Download
1 / 27
270 likes | 402 Views
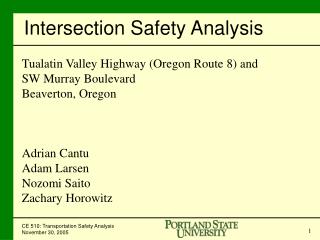
Murray Boulevard and Farmington Road Intersection. CEE 550 Transportation Safety Analysis. Sirisha Kothuri Wei Feng Ping Guo Meead Saberi. Outline. Introduction Site Description Crash Data Analysis Literature Review Countermeasures Cost/Benefit Analysis Recommendations.

E N D
Murray Boulevard and Farmington Road Intersection CEE 550 Transportation Safety Analysis Sirisha Kothuri Wei Feng Ping Guo Meead Saberi
Outline • Introduction • Site Description • Crash Data Analysis • Literature Review • Countermeasures • Cost/Benefit Analysis • Recommendations
Introduction • Murray Boulevard • 2 lane undivided • Runs N-S • Farmington Road • 2 lane undivided • Runs E-W • Intersection • City of Beaverton • 4-leg signalized • Slight skew • High Volume Map of Intersection
MurrayBlvd Apt Apt Farmington Road 7-Eleven Apt Site Description - I Aerial View of the Intersection
Site Description - II Illumination at Intersection Signal at Intersection Barrier at Intersection Pavement Markings at Intersection
Site Description - III Speed Limit Sign on Farmington Speed Limit Sign on Murray Driveways near Intersection School Zone Signs
Site Description - IV Heavy Vehicles Queue Spillover to Adjacent Intersection
Volume Source: City of Beaverton
Crash Data Analysis • Oregon Transportation Safety Data Archive (ortsda) • Crash File • Crashes for 4 Years (2003 -2006) at intersection • Vehicle File • Information about vehicles involved in crashes at intersection • Participant File • Information about drivers involved in crashes at intersection • Crash Patterns at the Intersection • Time of Day • Type of Crash • Severity • Weather • Light Conditions • Driver Characteristics • Residence Status • Gender • Age
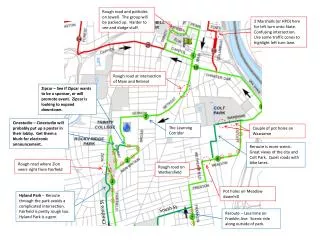
Murray Blvd Farmington Rd Collision Diagram
Rear End Crashes Most common type at signalized intersections Account for one-third of all reported crashes in US Mostly PDO, sometimes severe injuries and fatalities occur Causes Driver Behavior – Inattentive driving, smaller headways Driver Age and Gender Heavy Traffic Volumes Dilemma Zone Literature Review
Dilemma (Indecision) Zone Source: Heng Wei, Characterize Dynamic Dilemma Zone and Minimize its Effect at Signalized Intersections, Ohio Transportation Consortium (OTC), 2008
Countermeasures • Reduce speed limit on approaches • 35 mph on Murray Blvd • 30 on Farmington Road • Pros • Reduction in all types of crashes • Cons • Increase in delay • Diversion of vehicles to other streets
Countermeasures • 2. Advance Signal • Warning Signs • Murray Blvd & Farmington Rd • Pros • Reduction in Rear End Crashes • Low cost • Easy Implementation • Cons
Countermeasures • Improve Signal Timing • Optimize to ITE Standards • Pros • Reduces Rear End PDO crashes • Cons • Increases Fatal and Injury crashes
Countermeasures • 4. Coordinated Signals • Coordinate adjacent intersections • Pros • Allows progression of vehicles • Reduces all types of crashes • Cons • Hard to implement
Select Countermeasures For each countermeasure, extract CRF Calculate reduction in crashes Calculate annual benefits and costs Assume discount rate of 4% Calculate NPV = NPVB – NPVC Rank countermeasures in decreasing order of NPV Cost Benefit Analysis
Cost Benefit Analysis Cost of All Crashes at Intersection
Cost Benefit Analysis • Reduce vehicle’s approach speed limit
Cost Benefit Analysis 2. Advance Signal Warning Signs
Conclusions & Recommendations • Rear-end crashes are common at signalized intersections. • Typical causes • Driver Behavior • Driver Age & Gender • Heavy Traffic Volumes • Dilemma Zone • Countermeasures Ranking Based on B/C Analysis • Install Advance Signal Warning Signs • Reduce vehicle’s approach speed limit • Signal Coordination
Dr. Chris Monsere, PSU Jabra Khasho, City of Beaverton Baotu Ho, City of Beaverton Acknowledgements