Download
1 / 47
520 likes | 712 Views
Vineyard Establishment - Viticultural Regions. Gerard Logan. INTRODUCTION. Viticultural Areas of the World Europe (Italy, France, Germany………) America (Canada, USA, Mexico……..) Africa (South Africa..........................) Australasia (New Zealand, Australia). NZ Statistics.

E N D
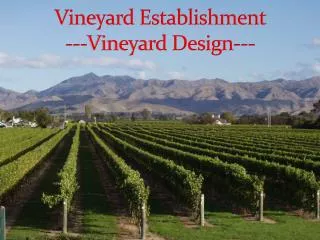
Vineyard Establishment- Viticultural Regions Gerard Logan
INTRODUCTION • Viticultural Areas of the World • Europe (Italy, France, Germany………) • America (Canada, USA, Mexico……..) • Africa (South Africa..........................) • Australasia (New Zealand, Australia)
NZ Statistics • Population:- 4.25 Million People • GDP:- NZ$ 125 Billion (US$ 98.5 Billion) • Wine Stats:- NZ – 22,616 Ha, 182,886 Tonnes, 530 Wineries • Marlborough – 11,488 Ha, 113,436 Tonnes, 110 Wineries • Total Sauvignon Blanc – 8,860 Ha, 96,686 Tonnes • Total Pinot Noir – 4,063 Ha, 22,062 Tonnes • Total Chardonnay – 3,779 Ha, 26,944 Tonnes • Total Merlot – 1,420 Ha, 11,206 Tonnes • Exports to USA - NZ$138.5 Million • To UK #1 at $167 Million • NZ is 0.4% World Wine Production, yet very competative.
In Contrast…… • World Vineyard Area = 8,846,363 Ha • (NZ = 22,616 Ha) (0.25%) • World Wine Production = 286,175,000,000 L • (NZ = 1,200,000,000 L) (0.419%) • World Wine Consumption = 239,877,000,000 L • (NZ = 680,000,000 L) (0.283%) • Per Capita Consumption = 36.07 L / Person / Year • (NZ = 16.68 L / Person / Year) #33 • Who is number 1???
Vatican City State 62.02 L • Andora 60.13 L • France 55.85 L • Luxembourg 52.70 L • Norfolk Island 50.29 L • Italy 48.16 L • Portugal 46.67 L • Slovenia 43.77 L • Croatia 42.27 L • Switzerland 39.87 L • Spain 34.66 L • Hungary 33.06 L • Denmark 31.37 L
NZ Climatic Data • Coastal Climate, Thin Land, Large Coastal Area • National Averages (30 Stations) • Rainfall 1448 mm (6749mm – Milford) • Less than 100 “Rain Days” (186 Days – Milford) • Sunshine Hours 1,985 (2,409 Hours - Blenheim) • Mean Temp (AMSL) All Year 12.4 C (15.7 C – Kaitaia) • Warmest +41.6 C (Christchurch) • Coldest -15.6 C (Lake Tekapo) (-57.0 Scott Base) • Frost 55.5 Days/Year (149 Lake Tekapo) (365 Scott Base) • Snow AMSL Minimal, Far South. • Wind 14k/h – Very Windy! (25km/h (Ave) Chatham Is)
Wine Regions • Northland • Auckland • Waikato • Gisborne • Hawkes Bay • Wellington • Nelson • Marlborough • Canterbury • Central Otago
Marlborough • Planted Commercially in 1973, Brancott Estate • Largest Grape Growing Region in NZ • Both by Area and Volume (11,488Ha, 113,436t) • Best Climate • Warm Days, Cool Nights • Good Sugar Production • Retention of Acids, Flavours and Colour • Best For Table Wine Production • 110 Wineries • Sauvignon Blanc – Flagship • Home to NZ Wine Research Centre of Excellence
Canterbury • NZ’s Fifth Largest Region • 54 Wineries, 925 Ha • Consists of Two Areas • “Plains” Late ’70’s • Waipara more recently • Chardonnay, Pinot noir (60%) with some Riesling. • Long Dry Summer, many Sunshine hours, Cool Climate Wine Production. • Home to Lincoln University Centre V&O.
Otago • NZ’s Fourth Largest Region • 93 Wineries, 1,253 Ha • Mostly Pinot noir with some Pinot Gris. • Long Dry Summer, many Sunshine hours, Cooler Climate Wine Production.
Hawkes Bay • Oldest, Second Largest Producer in NZ • 69 Wineries • Syrah, Cabernet Sauvignon, Merlot, Chardonnay, Riesling grow well. • 157 yr Wine Heritage • 1851, French Catholic missionaries arrived to settle at Pakowhai, bringing with them the first vines to plant for their communion wine. • 22 Soil Types, Pan – Silt • Influence ripening +/- 3 Weeks of normal • Sacramental Wine
Gisborne • NZ’s Third Largest Region • 21 Wineries, 1,913 Ha • Mostly famous for Chardonnay, but produce most common New Zealand cultivars. • Home to Riversun Nurseries
Auckland • New Zealands 8th largest region – No I’m not just bulking up my lecture! • Home to The University of Auckland’s Wine Research Centre and Master of Wine Science Programme. • Waiheke Island included in this area….. • Chardonnay, Cabernet, Riesling, Pinot gris.. • Gateway to the World…….
INTRODUCTIONREGIONAL SELECTION • The major grape growing areas in the world can be divided into distinct regions based on wine styles produced: • In Europe Champagne is produced in the northern areas where grapes rarely ripen • In contrast, fortified wines are produced in Spain and Portugal where high sugar levels are easily achieved • The same can be said for New Zealand areas
CLIMATE • It is necessary for the winemaker and viticulturist to decide on a wine style • And then select the most suitable region by looking at all the effects of climate on quality • Concept known as ‘Brand to Land’ • Traditionally the grower has the land and then decides which variety to grow
Jackson, D.I. and Schuster, D. (1994). The Production of Grapes and Wine in Cool Climates.
Modified from Jackson, D.I. and Schuster, D. (1994). The Production of Grapes and Wine in Cool Climates.
Jackson, D.I. and Schuster, D. (1994). The Production of Grapes and Wine in Cool Climates.
Climatic Indices • Temperature Indices • Temperature determines: • Length of growing season • The efficiency in promoting growth • Ability to ripen a given crop / cultivar
Growing Degree Days (GDD) • Is the sum of mean daily temperature above 10C during the growing season from bud burst to ripening • Growing degree days for a month are calculated by subtracting 10C from the mean monthly temperature and multiplying by the number of days in the month
Climatic Indices • The base temperature of 10C is selected for grapevines as the minimum temperature for grapevine growth • Add the GDD for each relevant month to obtain total GDD
Climatic Indices • The degree-day summation gives a fair measure of temperature conditions during the growing season • It is useful in comparing vine growing areas
Climatic Indices • GDD does not: • Give the distribution of heat during the growing season • Indicate the daily and monthly width of temperature • The monthly minimum and maxima • Include Light – daylength, intensity, distribution, saturation
Gladstone, J. (1992). Viticulture and Environment. Winetitles.
Gladstone, J. (1992). Viticulture and Environment. Winetitles.
Temperature of the warmest month (TWM) • Mean temperature of the warmest month (TWM) • In New Zealand, mean January temperature (MJT) • This index has been found to correlate well with growing degree days
Climatic indices • Examples of MJT for New Zealand Wine Regions: Auckland 19.1 Napier 18.6 Blenheim 17.3 Canterbury 17.2
Mean Annual Range (MAR) • Also referred to as TRANGE or Continentality • This index gives an idea of the range of temperature from winter to summer • A continental region will have relatively cold winters and high MAR value
Climatic indices • A maritime (coastal) region will have temperature variations reduced by the presence of the ocean (a relatively warmer winter and a low MAR value) • In two regions with identical MJT but differing MAR, the ability of grapes to ripen will be lower in the region with the higher value of MAR • MAR is a useful adjunct to MJT
Gladstone, J. (1992). Viticulture and Environment. Winetitles.
Gladstone, J. (1992). Viticulture and Environment. Winetitles.
Rainfall and temperature indices • Temperature and rainfall of a region can indicate: • potential water stress • drought periods • These indicate: • the need for supplementary irrigation • potential disease risk
BRANAS Index Developed in France for the prediction of incidence of fungal disease The index for each month was calculated by multiplying the mean monthly temperature (°C) by the mean monthly precipitation (mm) The index was summed for a 6 month period, October to March in the southern hemisphere, April to September in the northern hemisphere. The higher the value, the greater is the humidity over the growing season, and thus the greater is the disease risk
BRANAS Index Region Growing Degree Days TWM Branas AustraliaSwan Valley 2340 24.4 2400Griffith 2145 23.6 4100Magill 2080 22.9 3200Mudgee 1990 22.7 7300Rutherglen 1790 22.9 4800Clare 1780 22.0 3600Great Western 1700 21.6 3700Barossa Valley 1680 21.3 2900Coonawarra 1420 20.6 3300 FranceBordeaux 1440 20.0 6200Burgundy 1100 19.0 6300Champagne 1030 18.5 5100
BRANAS Index Region Growing Degree Days TWM Branas New Zealand Christchurch 897 17.0 4552 Queenstown 721 15.8 5645 Blenheim 1101 17.8 4535 Napier 1360 18.9 6220 Auckland 1514 19.9 8324 California Fresno 2600 800 San Jose 1470 800 Cameras 1100 1000
Other Climatic Variables • WIND • Damage shoots, reduce flower set, lower temperature, reduce photosynthesis • HAIL • Hail can significantly damage berries and leaves, reducing both yield and quality
Other Climatic Variables • FROST • Spring and autumn frosts can cause severe damage to grapevines • SUNSHINE • The sunshine received in most of Australasia is in excess of the grapevine's requirements and this is not a limiting factor
Textbook readings • “Gladstones (2002) Viticulture and the Environment” Pages 192-197 • “Jackson and Schuster (2001) The Production of Grapes and Wine in Cool Climates” Pages 27-45 • “Jackson (2000) Wine Science: Principals, Practice, Perception” Pages 1-11 • Pre-Read • “Jackson (2000) Wine Science: Principals, Practice, Perception” Pages 13-40
Next Topic......... • Vitisspecies plant materials