Download
1 / 29
300 likes | 603 Views
Transcriptional Regulatory Networks. ANSCI 490 M Instructor: Lei Liu, PhD November 12, 2002 Daniel H. Barnett Department of Cell and Structural Biology University of Illinois at Urbana-Champaign. Biological Networks – Coming of age?.

E N D
Transcriptional Regulatory Networks ANSCI 490 M Instructor: Lei Liu, PhD November 12, 2002 Daniel H. Barnett Department of Cell and Structural Biology University of Illinois at Urbana-Champaign
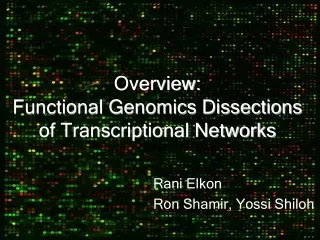
Biological Networks – Coming of age? October 25, 2002, Friday Gains in Understanding Human Cells By NICHOLAS WADE (NYT) 993 wordsLate Edition - Final, Section A, Page 18, Column 4 ABSTRACT - Scientists at Whitehead Institute in Cambridge, Mass, have made significant stride toward understanding how a living cell's operations are controlled by information in its genome; insight, which gives detailed view of complex, computer-like biological circuitry, should help researchers understand cellular programming errors that underlie diseases; study was made possible by several recent advances in technology, such as DNA decoding machines; findings are reported in journal Science.
Background – Transcriptional Networks • How to cells coordinately control “routine” and diverse processes such as cell cycle, development, and metabolism? • How do cells coordinately control “routine” processes AND properly respond to environmental stimuli? • If gene expression is ultimately modulated by transcriptional regulators, then what regulates the regulators? • Transcriptional Regulatory Networks • Previous work has focused on global measurement of mRNA expression as an output of regulatory networks • - reverse engineering by Singular Value Decomposition (SVD) to form nodes & possibly link to transcriptional regulators • - use of prior knowledge of regulatory network composition or architecture • Is there a more direct way to test the regulation of gene expression by transcription factors & organize them in a meaningful way?
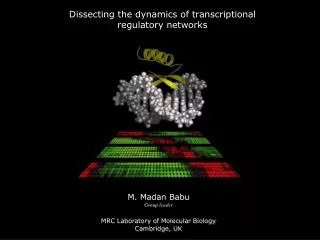
Background – Transcriptional Networks Wyrick and Young, 2002
Background – Models and Techniques • Saccharomyces cerevisiae • - or the “functional genomics workhorse” • 1st eukaryote to have entire genome sequenced • ~200 proteins which regulate transcription of ~6200 genes Yeast Proteome Database • Tremendous amount known about mechanisms of action of transcriptional regulators (e.g. Gal4) • Genome-wide Location Analysis makes it possible to couple DNA-protein interactions with gene expression analysis to monitor coordinated gene regulation at whole-genome level • Ren, B., F. Robert, et al. (2000). "Genome-wide location and function of DNA binding proteins." Science 290(5500): 2306-9. • Simon, I., J. Barnett, et al. (2001). "Serial regulation of transcriptional regulators in the yeast cell cycle." Cell 106(6): 697-708. Wyrick and Young, 2002
Background – Genome-wide Location Analysis Wyrick and Young, 2002
Transcriptional regulatory networks in Saccharomyces cerevisiae • Science 2002 Oct 25;298(5594):799-804 • Lee TI, Rinaldi NJ, Robert F, Odom DT, Bar-Joseph Z, Gerber GK, Hannett NM, Harbison CT, Thompson CM, Simon I, Zeitlinger J, Jennings EG, Murray HL, Gordon DB, Ren B, Wyrick JJ, Tagne JB, Volkert TL, Fraenkel E, Gifford DK, Young RA. • web.wi.mit.edu/young.regulator_network - Supporting website • Features of note • Effectively coupled “Genome-wide Location Analysis” with genome-wide expression analysis in model eukaryote Saccharomyces cerevisiae • Uncovered network motifs which underlie regulatory capacities in entire genome • Developed an automated process which was successful in building large network structures “de novo” by combining genome-wide location analysis with genome-wide expression analysis data without prior knowledge of regulator functions • By use of this process, connections of cellular networks were noted to permit coordination of functions within cell which had been eluded to, but difficult to prove • Provides a template for developing similar models of transcriptional regulatory circuits which will be helpful in understanding complex systems and how they are regulated.
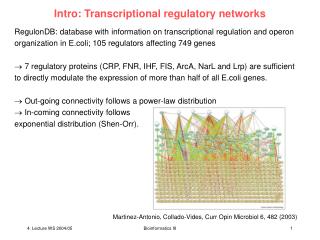
Genome-wide Location Analysis (Figure One) Attempted to examine all 141 known transcription factors in Yeast Proteome Database (-) 17 proteins without viable myc tags (-) 18 tagged but not expressed proteins = 106 viable tagged strains for Genome-wide Location Analysis
Analysis – Determination of Binding Sites • Visual examination of scans & distribution of scatter plots about 45 deg. • Computed by SD of log ratio • Rank of all chips by SD, from low to high • Avg. of ranks of each chip comprising an experiment were used as a score for experiment • Below 300 – good 300-350 – acceptable above 350 – poor • - Background-subtracted intensity values - each spot yields fluorescence intensity information in two channels (immunoprecipitated DNA and genomic DNA). • - Background hybridization to slides accounted for by subtraction of the median intensity of a set of control blank spots. • - Different amounts of genomic and immunoprecipitated DNA hybridized to the chip corrected: • median IP-enriched DNA channel / median genomic DNA channel => applied to each genomic DNA channel. • - Determine log of (IP-enriched channel : genomic DNA channel) for each intergenic region across the entire set of hybridization experiments. • - Systematic bias accounted for by normalizing the log ratios for a specific intergenic by subtracting the average log ratio for that intergenic region. • - A whole chip error model (Hughes et al 2000 Cell) was used to calculate confidence values (p-values) for every spot and to combine data for the replicates of each experiment to obtain a final average ratio and confidence for each intergenic region.
Analysis – Effect of p-value Cutoff • Rather than use “bound vs. unbound” criteria, confidence measures (p-values) used. • - Inherent noise from microarray data • - DNA binding proteins are in equilibrium between bound and unbound states • Which p-value to use?? • More stringent p-values reduce the number of interactions observed, but decrease the likelihood of false positive results. • Generally used a p-value threshold of 0.001 to analyze, discuss and generate regulatory models - minimizes false positive results, but allows an increase in false negative results.
Experimental Confirmation Quantifying False PositivesConventional, gene-specific ChIP experiments confirmed 89 of 95 binding interactions (involving 28 different regulators) that were identified by location analysis data at a threshold p-value of 0.001. • This suggests that empirical rate of false positives is 6%. • Quantifying False NegativesThe 0.001 p-value threshold may result in an underestimate of regulator-DNA interactions. • The determination of a true false negative rate was not feasible, but gene-specific PCR analysis with selected regulators was used to test the results predicted at each of the different p-value thresholds. • Nrg1 and Stb1 – genes with p-values closest to one of four thresholds (0.001, 0.005,0.01,0.05) and performed chromatin IP and gene-specific PCR - at least 2,300 additional genuine regulator-gene interactions exist among our results at all p-values above 0.001. • Computational Estimation of False-Positive Rate • Estimate a false positive rate by determining the number of spots below our p-value threshold of 0.001 in these control DNA vs. control DNA arrays - 1,000 groups of three ‘arrays’ by randomly selecting six sets of measurements from the control DNA arrays, 3/ fluorophore. • Results indicate that an average of 3.7 out of ~6500 intergenic regions significantly enriched using the 0.001 threshold ~ actual experiments is 38, so from this we estimate an avg. false positive rate of 10%. • Literature Confirmation of the Data • Authors found that the location data generally agree with the published literature. • No accurate estimate false-positive rate because the literature is incomplete. • Some regulator-gene interactions in literature not observed, indicating that some interactions are not reported by the location data at a p-value threshold of 0.001. Analysis – Confirmation of Predicted Binding
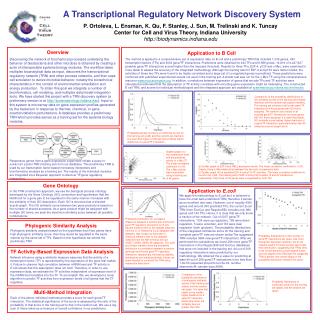
Promoter-Regulator Interactions (Figure Two) Nearly 4000 regulator-promoter interactions at p< 0.001. The promoter regions of 2343 of 6270 yeast genes (37%) bound by one or more of the 106 transcriptional regulators. Location Data Chance
Promoter-Regulator Interactions (Figure Two) Cont. The number of different promoter regions bound by each regulator ranged from0 to 181 (0.001 p-value) avg. = 38 promoter regions per regulator
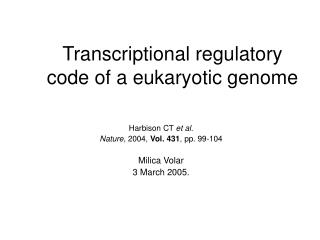
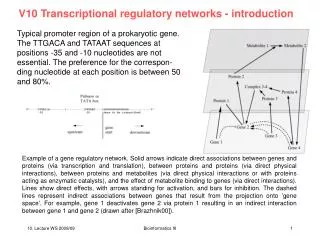
Network Motifs (Figure Three) Simplest units of commonly used network architecture (network motifs) - provide specific regulatory capacities such as positive and negative feedback loops. Motifs can be assembled into network structures that help explain how a complex gene expression program is regulated. Six different regulatory network motifs identified in yeast by G-WLA.
Network Motif Search Algorithms The overall matrix D consists of binary entries Dij, where a 1 indicates binding of regulator j to intergenic region i with a p-value of less than or equal to 0.001, a 0 indicates a p-value greater than 0.001. The regulator matrix R is a subset of D, containing only the rows corresponding to the intergenic region assigned to each regulator, in the same order as the columns of regulators. - Autoregulatory motif: Find each non-zero entry on the diagonal of R. - Feedforward loop: For each master regulator (column of R), find non-zero entries, which correspond to regulators bound. For each master regulator / secondary regulator pair, find all rows in D bound by both regulators. - Multi-component loop: For each regulator (column of R), find the regulators to which it binds. For each of these, find the regulators it binds. If any of these are the original regulator, you have a multi-component loop of two. For all others, find regulators to which they bind. If any of these are the original, you have a multi-component loop of three. Repeat to find larger loops. - Single input module: Find the intergenic regions bound by only one regulator. That is, take the subset of rows of D such that the sum of each row is 1. Then for each regulator (column), find non-zero entries. Each set (greater than three intergenic regions) is a SIM. - Multi-input module: Find the intergenic regions bound by more than one regulator. That is, take the subset of rows of D such that the sum of each row is greater than 1. Then, for each row, find any other row bound by the same regulators. The collection of rows bound by the same regulators correspond to a MIM. Once a row is assigned to a MIM, remove it from further analysis. - Regulator cascade: For each regulator (column of R), use a recursive algorithm to find chains of all lengths. That is, for each regulator whose promoter is bound by the regulator before it in the chain, find the regulator promoters to which it binds. Repeat until the chain ends. There are three possible ways to end a chain: a regulator that does not bind to the promoter of any other regulator, a regulator that binds to its own promoter, or one that binds to the promoter of another regulator earlier in the chain.
Network Super Structure Assembly Regulatory motif refinement Algorithm was developed to explore all the genome-wide location data together with the expression data from over 500 expression experiments to identify groups of genes that are both coordinately bound and coordinately expressed. The algorithm begins by defining a set of genes, G, that are bound by a set of regulators S, using the 0.001 p-value threshold. A large subset of genes in G are similarly expressed over the entire set of expression data, and use those genes to establish a core expression profile. Genes are then dropped from G if their expression profile is significantly different from this core profile. The remainder of the genome is scanned for genes with expression profiles that are similar to the core profile. Genes with a significant match in expression profiles are then examined to see if the set of regulators S are bound. At this step, the probability of a gene being bound by the set of regulators is used, rather than the individual probabilities of that gene being bound by each of the individual regulators. Because assaying the combined probability of the set of regulators being bound, and relying on similarity of expression patterns, the p-value can be relaxed for individual binding events and thus recapture information that is lost due to the use of an arbitrary p-value threshold. The process is repeated until all combinations of genes bound by regulators have been considered. The resulting sets of regulators and genes are essentially multi-input motifs refined for common expression (MIM-CE).
Assembly of Motifs into Network Structures Assembling network structure The refined motifs were used to construct a network structure for the yeast cell cycle using an automatic process that requires no prior knowledge of the regulators that control transcription during the cell cycle. Cell Cycle - Extensive genome-wide expression data and literature to explore features of model - use to determine if a principled computational approach can reproduce substantial portions of the simple network that was previously modeled using a more directed approach (Simon et al, 2001 Cell) – determine whether the computational approach would construct the regulatory logic of cell cycle from the location and expression data without previous knowledge of the regulators involved. 11 regulators identified by using MIM-CEs significantly enriched in genes whose expression oscillates through the cell cycle. To construct the cell cycle network, a new set of MIM-CEs was generated using only the eleven regulators and the cell cycle expression data. This two-step procedure is a general method for constructing other regulatory networks. To produce a cell cycle transcriptional regulatory network model, the MIM-CEs were aligned around the cell cycle based on the peak expression of the genes in the group using an algorithm described previously (Bar-Joseph et al., 2002). Since MIM-CEs contain genes that are co-expressed, the expression data was used to instruct the assembly of the network to represent this temporal process.
Yeast Cell Cycle Model – Transcriptional Regulatory Network (Figure Four)
Network of Regulator-Regulator Relationships (Figure Five) Cont.
Network of Regulator-Regulator Relationships (Figure Five) Cont.
Network of Regulator-Regulator Relationships (Figure Five) Cont.
Coordination of Cellular Processes • Coordination of gene expression programs is likely to be particularly important for coordinating fundamental cellular processes. • - Regulators bind genes encoding regulators within same category (e.g. cell cycle). • Cell cycle regulators bound to other cell cycle regulators (Simon et al 2002), and this phenomenon was also apparent among transcriptional regulators that fall into the metabolism and environmental response categories. • - Multiple regulators bind promoters for genes which regulate other cell processes. • Multiple transcriptional regulators within each category bind to genes encoding regulators that are responsible for control of other cellular processes. These observations are likely to explain, in part, how cells coordinate transcriptional regulation of the cell cycle with other cellular processes. These connections are generally consistent with previous experimental information regarding the relationships between cellular processes. • The control of most, if not all, cellular processes is characterized by networks of transcriptional regulators that regulate other regulators. It is also evident that the effects of transcriptional regulator mutations on global gene expression as measured by expression profiling the direct targets of a single regulator.
Conclusions, revisited • Effectively coupled “Genome-wide Location Analysis” with genome-wide expression analysis in model eukaryote Saccharomyces cerevisiae • Uncovered network motifs which underlie regulatory capacities in entire genome • Developed an automated process which was successful in building large network structures “de novo” by combining genome-wide location analysis with genome-wide expression analysis data without prior knowledge of regulator functions • By use of this process, connections of cellular networks were noted to permit coordination of functions within cell which had been eluded to, but difficult to prove • Provides a template for developing similar models of transcriptional regulatory circuits which will be helpful in understanding complex systems and how they are regulated.
References 1. Lee, T. I., N. J. Rinaldi, et al. (2002). "Transcriptional regulatory networks in Saccharomyces cerevisiae." Science 298(5594): 799-804. 2. Ren, B., F. Robert, et al. (2000). "Genome-wide location and function of DNA binding proteins." Science 290(5500): 2306-9. 3. Ren, B., H. Cam, et al. (2002). "E2F integrates cell cycle progression with DNA repair, replication, and G(2)/M checkpoints." Genes Dev 16(2): 245-56. 4. Simon, I., J. Barnett, et al. (2001). "Serial regulation of transcriptional regulators in the yeast cell cycle." Cell 106(6): 697-708. 5. Wyrick, J. J. and R. A. Young (2002). "Deciphering gene expression regulatory networks." Curr Opin Genet Dev 12(2): 130-6.
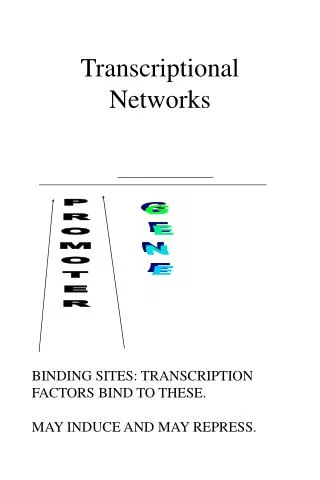
Background – Basic Example of Transcription Factor Association Lee and Kraus, 2001
ChIP - Chromatin immunoprecipitation assay (ChIP) Lee and Kraus, 2001
Background – Combining G-WL Analysis and Traditional Expression Analysis in Physiological Models Wyrick and Young, 2002