Modeling Regulatory Networks
Modeling Regulatory Networks. John Griffin CS 374 Stanford Fall 2004. Two primary articles. “Module networks: identifying regulatory modules and their condition-specific regulators from gene expression data” Segal, Shapira, Regev, Pe’er, Botstein, Koller, Friedman [SSR]

Modeling Regulatory Networks
E N D
Presentation Transcript
Modeling Regulatory Networks John Griffin CS 374 Stanford Fall 2004
Two primary articles • “Module networks: identifying regulatory modules and their condition-specific regulators from gene expression data” Segal, Shapira, Regev, Pe’er, Botstein, Koller, Friedman [SSR] Nature Genetics, June 2003 • “Probabilistic discovery of overlapping cellular processes and their regulation” Battle, Segal, Koller [BSK] RECOMB ’04 conference, March 2004 • Second article builds on and extends first
Purposes of this research • Predict what genes work together as “modules” for different biological functions, and find what genes regulate each module under what conditions • Daphne Koller quoted in popular press article (supplementary reference 1): “What we’re doing is developing a suite of computational tools that take reams of data and automatically extract a picture of what’s happening in the cell….It tells you where to look for good biology.”
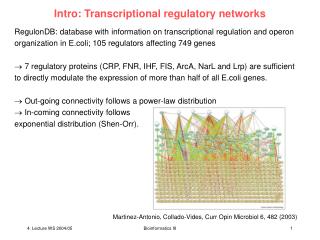
Outline • Microarray technology radically improves gene expression data volume & precision • Key terms • Bayesian networks overview • SSR article • BSK article • References
Background and motivation: “Observing the living genome,” 1999 article (supplementary reference 2) “…DNA microarrays have the advantage of being comprehensive, inexpensive (in the case of printed DNA microarrays) and easy to use; an entire genome can be surveyed in a single hybridization experiment. Surveying the variation in abundance of each gene’s transcripts across an arbitrary series of samples is simply a matter of measuring the differential hybridization to a DNA microarray of fluorescently labeled cDNAs prepared from a series of mRNA samples.”
“Observing the living genome”1999 article (supplementary reference 2)
Typical microarray layout • Applications • Identification of gene sequence • Determination of expression level (abundance) of genes. • Each cell in array shows expression level of a particular gene. A single microarray slide gets exposed to a particular experimental condition.Fluorescence indicates expression level. • 2003: Affymetrix selling arrays with DNA for 30k-50k human genes – encode all known human proteins
Radical improvements “DNA microarray approaches to identifying differentially expressed genes are fundamentally different from the traditional methods. Most importantly, they are systematic. Previous genome-wide approaches produced ‘lists’ of differentially expressed genes, or, in some cases, semiquantitative counts of the relative frequency with which specific transcripts were encountered in sequencing cDNAs isolated under a given condition. The qualitative or semiquantitative nature of the results, and the labor-intensive methodology, prevented the assembly of coherent pictures of the ‘patterns’ in which each gene is expressed, or of the characteristic patterns of gene expression in each cell, tissue or process.”
Outline • Microarray technology radically improves gene expression data volume & precision • Key terms • Bayesian networks overview • SSR article • BSK article • References
Key terms • Bayes’ Rule, Bayesian networks • cis-regulatory motif • module • module group • cDNA • regulator • expression profile • node • regulation program / regulation tree
Key terms, 1 of 4 • Bayes’ Rule, Bayesian networks: to be explained • cis-regulatory motif: A short (6-to-12-ish) series of DNA bases that can bind to an “activator” or “repressor” protein. Illustrated at right as activator/repressor binding sites.
Key terms, 2 of 4 • Module: set of genes that participate in a coherent biological process • Module group: set of modules that all share at least one cis-regulatory motif • cDNA: single-stranded DNA that is complementary to messenger RNA or DNA that has been synthesized from messenger RNA by reverse transcriptase. This is what binds to the ordered array of DNA strands on microarrays
Key terms, 3 of 4 • regulator: a gene that encodes a protein whose concentration regulates the expression of other genes • expression profile: concentrations of various genes in given bio-experimental circumstances
Key terms, 4 of 4 • node: locus in a regulation program/tree. Ovals in diagram at left. • regulation program / regulation tree: Upper part of diagram. A representation of different modes of regulation of genes within a module. 3 types of modes: 1) unregulated, 2) more transcription due to activator gene “upregulation”, 3) less transcription due to repressor gene “upregulation.” See diagram, slide 11. Arrow in oval can point up for upregulation, down for downregulation.
Outline • Microarray technology radically improves gene expression data volume & precision • Key terms • Bayesian networks overview • SSR article • BSK article • References
Bayesian networks (BN) in brief • Graphs in which nodes represent random variables • (Lack of) Arcs represent conditional independence assumptions • Present & absent arcs provide compact representation of joint probability distributions • BNs have complicated notion of independence, which takes into account the directionality of the arcs
Bayes’ Rule Can rearrange the conditional probability formula to get P(A|B) P(B) = P(A,B), but by symmetry we can also get: P(B|A) P(A) = P(A,B) It follows that: The power of Bayes' rule is that in many situations where we want to compute P(A|B) it turns out that it is difficult to do so directly, yet we might have direct information about P(B|A). Bayes' rule enables us to compute P(A|B) in terms of P(B|A).
Simple Bayesian network example, from “Bayesian Networks Without Tears” article (supplementary reference 4): P(hear your dog bark as you get home) = P(hb) = ?
Need prior P for root nodes and conditional Ps, that consider all possible values of parent nodes, for nonroot nodes
Major benefit of BN • We can know P(hb) based only on the conditional probabilities of hb and its parent node. We don’t need to know/include all the ancestor probabilities between hb and the root nodes.
This BN benefit hugely reduces # of numbers and computations needed for large networks, e.g. hundreds or thousands of genes • SSR article: many separate Bayesian networks generated based on gene expression data. Here one activator and one repressor form basic BN, with 3 corresponding expression “contexts” shown at bottom.
Independence assumptions • Source of savings in # of values needed • From our simple example: are ‘family-out’ and ‘hear-bark’ independent, i.e. P(hb|fo)=P(hb)? Intuition might say they are not independent…
Independence assumptions • …but in fact they can be assumed to be independent if some conditions are met. • Conditions are symbolized by presence/absence and direction of arrows between nodes. • Knowing whether dog is or is not in the house is all that is needed to know probability of hearing a bark, so family being in or out is independent. This kind of independence assumption is what allows savings in how many numbers must be specified for probabilities.
Order of reduction of required numbers Complete specification of probability distribution of n binary random variables needs 2n – 1 joint probabilities (jp). So for our example, 31 jp would be needed. But BN independence assumptions can reduce this to just 10 jp (listed on slide 19).
Evaluating Bayesian networks • Generally NP hard!
Where do the numerical estimates of probability come from? • Can be, at least initialized with, expert opinion • Can be learned by system • Both SSR and BSK articles lay out basics and some details of iterative algorithms for finding probability numbers.
Bayesian networks applied to diverse applications “Computerized tongue diagnosis based on Bayesian networks”: devising expert system for Chinese medical method (supplementary reference 3)
For good entry-level BN tutorial: see supplementary references 4 and 5
Outline • Microarray technology radically improves gene expression data volume & precision • Key terms • Bayesian networks overview • SSR article • BSK article • References
Aims of SSR article • Bayesian network-based algorithms are applied to gene expression data to generate good testable hypotheses.
Results of SSR article • Expression data set, from other researchers circa 2000, is for genes of yeast subjected to various kinds of stress • Compiled list of 466 candidate regulators • Applied analysis to 2355 genes in all 173 arrays of yeast data set • This gave automatic inference of 50 modules of genes • All modules were analyzed with external data sources to check functional coherence of gene products and validity of regulatory program • Three novel hypotheses suggested by method were tested in bio lab and found to be accurate
Results of SSR article • 2 examples of 50 modules inferred by SSR methods: • Respiration – mostly genes encoding respiration proteins or glucose-metabolism proteins. One primary regulator predicted – Hap4 – which is known from past experiments to play activation role in respiration. Secondary regulators affect Hap4 expression. • Nitrogen catabolite repression – 29 genes tied to process by which yeast uses best available nitrogen source. Key regulator suggested is Gat1, due to 26 of 29 genes having Gat1 regulatory motif in their upstream regions.
Results of SSR article • Evaluating module content and regulation programs • All 50 modules were tested to see if proteins coded in same module had related functions • Scored modules on how many genes are noted in current bio databases as being related to the predicted function – diagram, next slide • 31 of 50 modules had coherence >50%; only 4 had coherence <30%.
Results of SSR article Colored boxes indicate that known experimental evidence validates the predicted regulatory role of a regulator (named in one of the ‘Reg’ columns) in a given module (each row of the table). M, C and G column headers and different colors of boxes represent different sorts of experimental evidence that validate the model’s prediction. C(%): functional coherence of module, from literature mentions of module genes. #G: number of genes in module
Results of SSR article • To find global relationships between modules, graph (next 2 slides) made showing modules & their motifs. Motifs were found within the 500 base pairs upstream from each gene. • Observations from this graph: modules with related biological functions often shared at least one motif, & sometimes shared one or more regulator genes.
Additional tests of predictions • Inferred regulator models were evaluated by comparing known functions of predicted regulators with their predicted regulation functions • Three previously untested hypotheses suggested by the model were tested with experiments comparing wild-type expression with deletion-type expression under the conditions hypothesized (e.g. heat shock and hypo-osmotic shift). A “paired-t test” showed that all three regulators do have roles in the hypothesized conditions.
Results summary • The method is able to accurately predict functions for regulators, their targets and experimental conditions under which regulation occurs.
Model-building method Three stages, illustrated on next slide: Preprocessing Module networks procedure Post-processing
Preprocessing Candidate regulators are chosen from among known and suspected transcription factors and signal transduction molecules. Informed choice of candidate regulators makes algorithm workable – without selectivity, bad results are likely.
Module network procedure Genes are partitioned into modules and regulation program is sought for each module to explain gene expression in module.
Post-processing “Enrichment” of annotations for predicted modules are sought in literature; enrichment of regulatory motifs sought within 500 base pairs upstream from genes
What does a BN look like here? • Need to specify two things to describe a BN • Graph topology (structure) • Parameters of each conditional probability distribution • Possible to learn both from data • Learning structure is much harder than learning parameters
Regulator programs: more complex Bayesian networks, made along lines of earlier simple example Simple generic example seen earlier…
…and real example: respiration & carbon regulation module (continued next slide)
Colored entries in columns on right show genes with enriched literature annotations for that column’s module (probabilities of overall enichments are at top of columns, previous slide)
Outline • Microarray technology radically improves gene expression data volume & precision • Key terms • Bayesian networks overview • SSR article • BSK article • References
BSK article overview • Authors: Battle, Segal, Koller • All from Stanford CS department • Proposes a “novel probabilistic model of gene regulation for the task of identifying overlapping biological processes and the regulatory mechanism controlling their activation.” • Detailed discussion of their COPR algorithm along with experimental methods and results • Builds on and extends work of Article 1; in particular, allows genes to simultaneously belong to more than one biological “process”