Download
1 / 54
550 likes | 699 Views
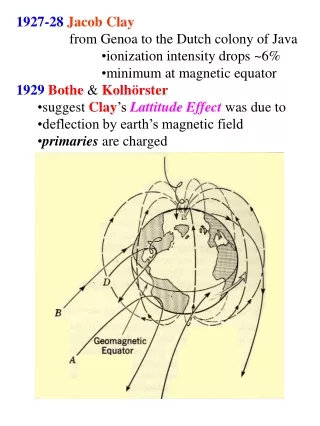
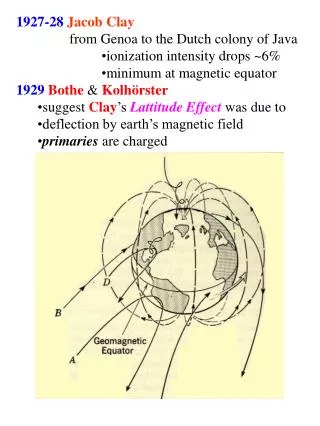
1927-28 Jacob Clay from Genoa to the Dutch colony of Java ionization intensity drops ~6% minimum at magnetic equator 1929 Bothe & Kolh ö rster suggest Clay ’s Lattitude Effect was due to deflection by earth’s magnetic field primaries are charged. N. S.

E N D
1927-28Jacob Clay • from Genoa to the Dutch colony of Java • ionization intensity drops ~6% • minimum at magnetic equator • 1929Bothe & Kolhörster • suggest Clay’s Lattitude Effect was due to • deflection by earth’s magnetic field • primaries are charged
N S
inspired by the Norwegian mathematician CarlStørmer’s • calculations explaining colleague Kristian Birkland’s theory • of the aurora • Birkland experimented with electron beams • and a phosphorous-painted globe of lodestone
1930-33Arthur Compton (University of Chicago) conducts a worldwide sea- and mountain-level lattitude survey of cosmic ray intensities and confirms the Latitude Effect. The 4 curves correspond to 4 seasons. Physical Review 52 [1937]:p.808
Størmer’s “cutoff energies”: only the fastest cosmics reach sea level near the equator less energetic particles are observable at mid-latitudes unrestricted energies in the polar regions
1933-35Thomas Johnson (of the Carnegie Institute) and Bruno Rossi (Italy) independently mount Geiger counter telescope arrays to test for the east-west asymmetry predicted by Georges Lemaître (Belgian)
Positive charged particles headed toward the earth from space, would tend (at mid-latitudes) to reach the surface coming down from the A. North B. South C. East D. West E. split East and West
Although cosmic rays do come “from all directions”, at high altitudes near the equator the intensity is higher coming from the West than from the East! 1939Johnson speculates primaries may be protons!
Balloon Electroscope Electroscopes become so robust, data can be collected remotely (for example retreived from unmanned weather balloons)
November 11, 1935 Explorer II, a 113,000 cubic foot helium balloon ascends to a record 22,066 m while collecting atmospheric and cosmic ray data.
Definite evidence for the celestial generation of Cosmic Rays came from fortuitous timing of a few high altitude balloon studies during some spectacular solar flares.
Unusual increase in Cosmic ray intensity associated with an intense solar flare observed February 28, 1942 the same sunspot associated with this flare erupts again March 7, 1942 Similarly the June 4, 1946solar prominence is followed by another eruption July 25, 1946 and the solar flare event of November 19, 1949 is also captured by airborne cosmic ray instruments each accompanied by a Sudden Ionospheric Disturbance which interrupts radio communications on earth
During the June 1946 prominence, ultraviolet radiation and x-rays arrived A. shortly before B. simultaneous to C. shortly after the visual observation of the flare. Why?
During the June 1946 prominence, charged particles causing radio blackouts arrived A. hours before B. minutes before C. simultaneous to D. minutes after E. hours later the visual observation of the flare. Particles causing radio blackouts arrived about 3 hours later. Why?
Rangeof human hearing: • 20 Hz – 20,000 Hz • Sensitivity • Threshold for hearing: 110-12 Watt/m2 • Increase of pressure on eardrum • 0.00003 Pascals (N/m2) above • normal atmospheric pressure: • 1 atm = 101,300 Pa • vibrating air molecules displaced by • an amplitude of ~110-10 m • 1/10 the diameter of an air molecule! • Threshold for pain: 1 Watt/m2 • 29 Pa above atmospheric pressure • Amplitude of vibrations 110-5 m • Not perceived as 1012times “as loud”
1 10 Moonlight ~ foot-candle working conditions 40-50 ft-candles outdoors at noon 10,000 ft-candles (sunlight) The human eye also responds logarithmically
10 9 8 7 6 5 4 3 2 1 0
10 9 8 7 6 5 4 3 2 1 0 300000 200000 100000 0
10 9 8 7 6 5 4 3 2 1 0 300000 200000 100000 0
10 9 8 7 6 5 4 3 2 1 0 300000 200000 100000 0
10 9 8 7 6 5 4 3 2 1 0 300000 200000 100000 0
10 9 8 7 6 5 4 3 2 1 0 100000 10000 1000 100 10 1 0.1 0.01
truly exponential graphs 0 1 2 3 4 5 become straight lines in a logarithmic plot! 0 1 2 3 4 5
What is the world’s most abundant element?
Average composition of clean, dry air at the Earth's surface Source: Garrels, MacKenzie and Hunt: Chemical cycles. 1975
Distribution of Elements in the Human Body (by weight)
Solar system masses Sun 1.981030 kg Jupiter 1.901027 kg Earth 5.981024 kg
Absorption “lines” • First discovered in spectrum of Sun (by an imaging scientist named Fraunhofer) • Called “lines” because they appear as dark lines super- imposed on the rainbow of the visible spectrum
Sun’s Fraunhofer absorption lines (wavelengths listed in Angstroms; 1 A = 0.1 nm)
Emission line spectra Insert various emission line spectra here
Emission line images Green: oxygen; red: hydrogen (blue: X-rays) Planetary nebula NGC 6543 Orion Nebula
The Nuclear pp cycle 4 protons 4He + 6g+ 2e 26.7 MeV
July 1969Apollo 11 astronauts trap cosmic ray particles on exposed aluminum foil, returned to earth for analysis of its elemental & isotopic composition. With no atmosphere or magnetic fieldof its own, the moon’s surface is exposed to a constant barrage of particles.
December 1972 Apollo 17’s lunar surface cosmic ray experiment measured the flux of low energy particles in space (foil detectors brought back to Earth for analysis. October 26, 1973 IMP-8 launched. Continues today measuring cosmic rays, Earth’s magnetic field, and the near-Earth solar wind from a near-circular, 12-day orbit (half the distance to the moon). October 1975 to the present GOES (Geostationary Orbiting Environmental Satellite) Early warning system monitoring the sun's for flares. 1977 The Voyager 1 and 2 spacecraft are launched. Each will explore acceleration processes of charged particles to cosmic ray energies.
Primary Cosmic Ray Flux (particles/m-2 sec) Solar System Composition (relative number of atoms) Atomic Number (Z) Element Hydrogen (H) 1 1.00 640 Helium (He) 2 6.8 10-294 Lithium, beryllium, boron 2.6 10-9 1.5 Carbon, Nitrogen, Oxygen 1.2 10-36 Iron (Fe) 26 3.4 10-50.24 All heavier atoms 1.9 10-60.13
50mm Cosmic ray strikes a nucleus within a layer of photographic emulsion
Primary cosmic ray Mostly photons, electrons and muons at Earth’s surface
A 1019 eV Extensive Air Shower 100 billion particles at sea level 89% photons 10% electrons ~1% muons 12 km 6 km 6 km
The Cosmic Ray Energy Spectrum Cosmic Ray Flux (1 particle per m2-sec) (1 particle per m2-year) (1 particle per km2-year) Energy (eV)
Refrigerator cold CO2 bubble (887 mph) 0.02 eV Room temperature nitrogen N2 (1160 mph) 0.03 eV Atoms in sun’s MILLION DEGREE surface 0.50 eV Energy given to each single electron when accelerated by AA battery 1.5 eV Electrons accelerated by your television picture tube (traveling ~1/3 speed of light) 30,000 eV Fermi National Lab’s high energy protons 1,000,000,000,000 eV
Recall: 1 joule = 6.2 x 10¹⁸ eV Superball bounced over your house 4 x 10¹⁷ eV Pitched baseball4 x 1020 eV Slammed hockey puck 1 x 10²¹ eV The highest energy Cosmic Rays are SUBATOMIC particles carrying the energy of MACROSCOPIC objects! 4 x 10²¹ eV = 60 joules
The Cosmic Ray Energy Spectrum FERMILAB’s protons Bounced Superball Pitched baseball Hockey Puck Energy (eV)