Government Grants Overview: Trends, Challenges, and Oversight
Learn about different types of government grants, their expenditure trends, challenges in the grant system, and provisions within the Division of Revenue Act. Explore the breakdown of grant expenditure by province and proposed oversight focuses. This presentation sheds light on the categorization, purpose, and administration of various grants.

Government Grants Overview: Trends, Challenges, and Oversight
E N D
Presentation Transcript
Conditional Grants Presenters: Mongana Tau and Yolanda Brown 17 February 2015
Outline • Conditional Grant categorisation and purpose • Conditional Grant expenditure trends • Provincial breakdown of grant expenditure • Grant system challenges • Provisions within the Division of Revenue Act on administration of grants • Proposed oversight focus
Schedule 4 Grants • These are allocations to provinces to supplement the funding of programmes or functions funded from provincial budgets. • Expenditure of schedule 4 grants do not form part of National Treasury’s in-year monitoring reports.
Schedule 5 Grants • This is funding provided for a specific purpose. • National Treasury publishes expenditure reports with regard to schedule 5 grants on a quarterly basis.
Schedule 6 and 7 Grants • Schedule 6 grants are allocations-in-kind to provinces for designated special programmes. • Expenditure of schedule 6 grants do not form part of National Treasury’s in-year monitoring reports. • Schedule 7 grants are unallocated funds for provinces for disaster response.
Agriculture, Forestry and Fisheries • The Agricultural grants registered expenditure of 90 per cent and above on average for the five year period under review.
Arts and Culture • Grant expenditure average of 85 per cent and above for the five year period under review.
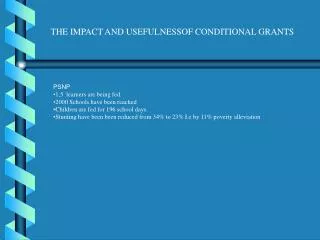
Basic Education • The National School Nutrition Grant and the HIV and Aids Grant registered expenditure of 90 per cent and above on average for the five year period under review; while • The spending performance of the Dinaledi Schools Grant and Technical Secondary Schools Recapitalisation Grant lags behind at an average of 84 per cent and 69 per cent, respectively.
Health • The Comprehensive HIV and Aids Grant registered expenditure of 95 per cent on average for the five year period under review; • The newly merged Health Facility Revitalisation Grant registered 83.3 per cent expenditure in its first year of implementation; and • Spending of the Health Insurance Grant started off slowly at 52 per cent in the first year of implementation (2012/13) and increased to 78.9 per cent in the following year.
Human Settlements • Average grant expenditure of 95 per cent and above, since implementation in 2010/11.
Public Works • The EPWP Integrated Grant registered high expenditure, since its implementation in 2012/13; while • The Social Sector EPWP Grant has registered expenditure of between 70 and 90 per cent for the period 2010/11 to 2013/14.
Sport and Recreation South Africa • Average grant expenditure of 90 per cent and above for the five year period under review.
Ilima/Letsema Project Grant Provincial grant expenditure was well below the 50 per cent quarterly expenditure benchmark for the second quarter of 2014/15.
Land Care Programme Grant This grant registered the most improved spending of all the schedule 5 grants by the end of the second quarter. Expenditure increased considerably from 5.4 per cent in the first quarter to 47.9 per cent in the second quarter of 2014/15.
Community Library Services Grant Provincial spending continued at a slow pace in the second quarter of 2014/15 at 33 per cent, well below the quarterly expenditure benchmark of 50 per cent.
Dinaledi Schools Grant The Eastern Cape and Western Cape provinces are the only provinces spending within reach of the quarterly expenditure benchmark of 50 per cent. The rest of the provinces will need to review their spending plans if they are to expend this grant funding in full by financial year-end.
HIV and Aids (Life Skills Education) Grant This grant expenditure was off to a slow start at 10.6 per cent in the first quarter but improved considerably to 42.4 per cent by the end of the second quarter.
National School Nutrition Programme Grant Grant spending by the provinces was on track at the end of the second quarter of 2014/15, except for Limpopo Province that was lagging behind at 42.2 per cent.
Technical Secondary Schools Recapitalisation Grant This grant registered the least expenditure of all the schedule 5 grants by the end of the second quarter of 2014/15 at 20.7 per cent. However, the Western Cape Province registered expenditure of 53.8 per cent in line with the 50 per cent benchmark.
Comprehensive HIV and Aids Grant Grant spending was on track in the majority of the provinces by the end of the second quarter of 2014/15, except for the Free State Province and Limpopo Province.
Health Facility Revitalisation Grant Spending by the provinces started off at a slow pace in the first quarter and continued into the second quarter at an average of 36.7 per cent, well below the 50 per cent benchmark.
National Health Insurance Grant Provincial grant expenditure was well below the 50 per cent quarterly expenditure benchmark for the second quarter of 2014/15, except for Gauteng province that registered expenditure of 53.6 per cent.
Human Settlements Development Grant Grant spending was on track in the majority of the provinces by the end of the second quarter of 2014/15, except for the provinces of Free State, Gauteng and Limpopo.
EPWP Integrated Grant for Provinces Grant spending at the end of second quarter was in line with the 50 per cent benchmark. However, grant spending differs significantly across the provinces. For example, the Eastern Cape registered the highest expenditure at 76 per cent and Gauteng the least at 11.9 per cent.
Social Sector EPWP Incentive Grant for Provinces Grant expenditure by the provinces would appear to be on track for 2014/15, except for Free State Province that was lagging behind at 23.8 per cent by the end of the second quarter.
Mass Sport and Recreation Participation Programme Grant Provincial grant expenditure was well below the 50 per cent quarterly expenditure benchmark for the second quarter of 2014/15.
Grant under-expenditure • These seven grants registered the least expenditure at the end of the second quarter of 20141/5: • Health Facility Revitalisation Grant – 36.7 per cent; • Ilima/Letsema Project Grant – 33.2 per cent; • Community Library Services Grant – 33.0 per cent; • Mass Sport and Recreation Participation Grant – 32.4 per cent; • Dinaledi Schools Grant – 24.7 per cent; • National Health Insurance Grant – 24.4 per cent; and • Technical Secondary Schools Recapitalisation Grant – 20.7 per cent.
Grant System Challenges • Shifting grants from direct to indirect and from one department to another • Poor planning characterised by slow procurement processes, submission of unsound plans that lack risk management or show unrealistic targets or do not show long term plans. • None compliance with reporting on spending, outputs and outcomes • Monitoring capacity constraints within national departments • Implementation capacity constraints – lack of technical skills • Poor project management that compromises quality of the work done • Under spending - some of the under spending are due to delays within supply chain processes, capacity constraints and service providers who fail to deliver • Questionable spending such as huge expenditure spikes and transfers to implementing agencies. • Disjuncture between allocation and impimentation
Provisions within the Division of Revenue Act on administration of grants • Duties of national transferring officers and duties of provincial receiving officers. • The role of National Treasury with regard to payment schedules and their amendment. • Spending purpose and conditions • Conditions for withholding and stopping or re-allocation of grants • Reporting requirements (financial and non-financial) • Conversion of allocations • Unspent allocations and request for roll-overs • Duties and powers of municipalities, provincial treasuries and National Treasury
Proposed oversight focus • National Departments that should be called before the Committee for: Reporting on financial and non-financial outcomes of grants administered by them – especially Schedule 4 and 6 grants. • Provinces that should be called before the Committee regarding overall conditional grant expenditure performance, especially Schedule 5 grants, should include: • Provincial Departments that fail to report appropriately. • Provincial Departments that underspent. • Oversight visit to certain projects of provinces that seem to be spending well to ascertain value for money spent. • Strengthening the provisions for grants during the Division of Revenue Bill 2015 processes.