Download
1 / 13
130 likes | 246 Views

E N D
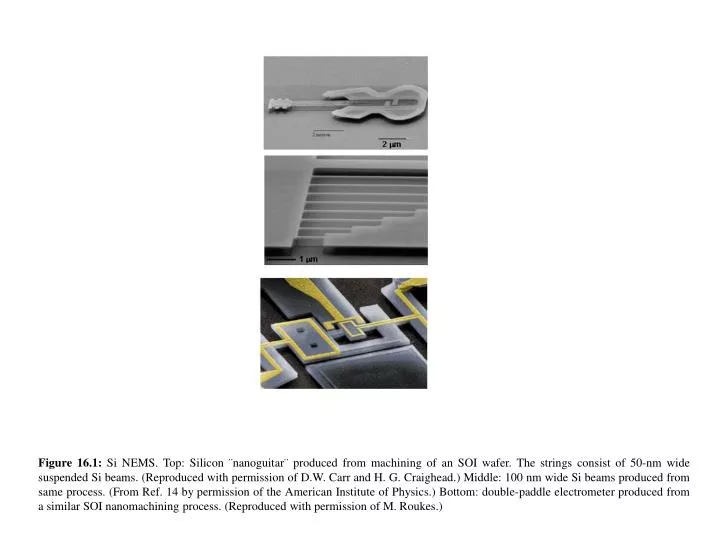
Figure 16.1: Si NEMS. Top: Silicon ¨nanoguitar¨ produced from machining of an SOI wafer. The strings consist of 50-nm wide suspended Si beams. (Reproduced with permission of D.W. Carr and H. G. Craighead.) Middle: 100 nm wide Si beams produced from same process. (From Ref. 14 by permission of the American Institute of Physics.) Bottom: double-paddle electrometer produced from a similar SOI nanomachining process. (Reproduced with permission of M. Roukes.)
Figure 16.2: Actuation and detection of resonant NEMS. Top: Interferometric approach, Bottom: Magnetomotive approach.
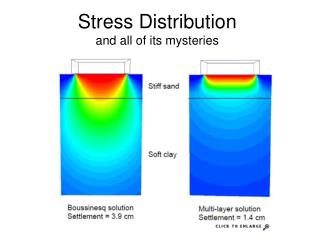
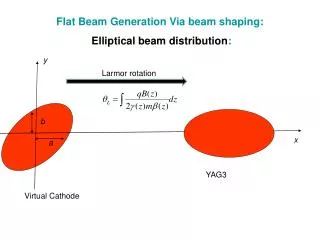
Figure 16.3: Flexural behavior of a straight beam and its stress distribution.
Figure 16.6: Nanomechanical paddle oscillator. (From Ref. 26 by permission of the American Institute of Physics.)
Figure 16.7: Modeling and experimental observation of onset of non-linear regime in flexural paddle resonators. (From Ref. 26 by permission of the American Institute of Physics.)
Figure 16.8: Experimental observation of DC tunability of torsional paddle nanoresonators. (From Ref. 26 by permission of the American Institute of Physics.)
Figure 16.9: Influence of an applied stress to the energy levels of a system.
Figure 16.10: Schematic illustration of a disordered atom group model.
Figure 16.11: The circuit of a SET where Cg, CT1 and CT2 are the gate and junction capacitances respectively and RT1and RT2 are the insulating barriers of the two tunnel junctions. (From Ref. 45 by permission of Macmillan MagazinesLtd.)
Figure 16.12: Schematic of a rf-SET displacement detector. (From Ref. 48 by permission of the American Institute of Physics.)
Figure16.13: Micrograph of a doubly clamped beam coupled to a SET. The displacement of the beam center point changes the coupled charge and modulates the current through the transistor. The resonating beam includes an interdigitated capacitor C(x) coupled to the gate of the SET. (From Ref. 51 by permission of the International Society for Optical Engineering.)