Download
1 / 18
180 likes | 272 Views
This presentation explores the factors influencing race reporting by Hispanics in the National Health Interview Survey, analyzing data from 1999-2003. The study investigates if Hispanics are more likely to report their race as "Other" compared to non-Hispanics and examines differences in race reporting among different Hispanic origin subgroups. Findings reveal significant associations between race reporting and demographic, household, and geographic characteristics, shedding light on the complexity of racial identification among Hispanics.

E N D
Determinants of Race Reporting by Hispanics in a National Health Survey Jacqueline Wilson Lucas, M.P.H. Division of Health Interview Statistics Elizabeth Arias, PhD. Division of Vital Statistics Presented at the NCHS Data Users Conference, July 12, 2006 The findings and conclusions in this presentation are those of the authors and do not necessarily represent the views of the Centers for Disease Control and Prevention.
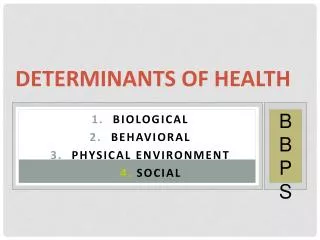
Background As of the 2000 Census, Hispanics are the largest minority group in the U.S. In the 2000 Census, 42.2% of the Hispanic population reported their race as “Some other race” The vast majority of persons in the Census who reported their race as “Some other race” – 97% - were Hispanic
Study Questions 1. Are Hispanics more likely to report their race as “Other” than non-Hispanics, controlling for a variety of factors? 2. Are there differences in race reporting by the type of Hispanic origin subgroup? 3. Are the factors associated with race reporting the same for all Hispanic national origin groups?
Methods The National Health Interview Survey (NHIS) is an annual survey of a nationally representative sample of the civilian non-institutionalized population of the United States Further information about NHIS available at the Web site: http://www.cdc.gov/nchs/nhis.htm Data used for analysis: Analysis limited to adult respondents to the survey 1999-2003 NHIS person and household level files 1999-2003 NHIS imputed income data files 2000 Census data geocoded to 1999-2003 NHIS data files to create population concentration measures Final sample sizes: All adults n=324,209; Hispanic adults n=68,591.
Methods, cont’d • Some proxy reporting of information in the person and household level data files. • Interviews are conducted in English and Spanish • Data are weighted to produce population estimates - weights adjusted for non-response and post-stratified to age, race, sex and Hispanic origin. • All statistical analyses were conducted using SUDAAN V. 9 software to account for the complex sample design of the NHIS and analyze multiply imputed data.
Methods, cont’d Dichotomous outcome variable: Race reporting status: One or more race groups = Race group reported Other race, DK, Ref, NA = Other race reported Based on responses to the question: “What race or races [fill1: Do you/Does ALIAS] consider [fill2: yourself/himself/herself] to be? Please select 1 or more of these categories.” White, Black/African American, Indian (American), Alaska Native, Native Hawaiian, Guamanian, Samoan, Other Pacific Islander, Asian Indian, Chinese, Filipino Japanese, Korean, Vietnamese, Other Asian
Independent variables used in multivariate analyses • Demographic characteristics • Age (18-34, 35-44, 45-64, 65+), sex, family size, marital status, nativity (U.S. vs. foreign-born) • Type of Hispanic origin: Puerto Rican, Mexican/Mexican American, Cuban, Dominican, Central/South American • Household characteristics • Residence in mono-racial or multiracial household • Residence in mono-ethnic or multiethnic household • Geographic characteristics • Region of residence, place of residence (MSA/CC, MSA/NCC, non-MSA) • Isolation index - the extent to which minority groups are exposed only to one another
Independent variables used in multivariate analyses, cont’d • SES factors: • Education • Imputed income (categorical dollar amounts) • Home ownership • Self or proxy reporting of data • Language of interview – considered, but data not usable
Statistical analyses Age-adjusted bivariate analyses of data Linear contrasts used to test differences in proportions Logistic regression models used to estimate likelihood of reporting race as Other/DK/REF (odds ratios)
Race reporting status by Hispanic origin subgroup, 1999-2003 NHIS SOURCE: Lucas, Arias, 2006
Multivariate Modeling 7 logistic regression models predicting Pr (reporting Other/DK/Ref) vs. Pr (reporting one or more groups) for: • All adults (Hispanic vs. Non-Hispanic) • All Hispanic adults (Hispanic subgroups compared) • Individual models for Hispanic subgroups (5 models: Puerto Rican, Mexican/Mexican American, Cuban, Dominican, Central/South American)
Study question #1 : Are Hispanics more likely to report their race as “Other” than non-Hispanics, controlling for a variety of factors? Model containing all adults and adjusting for all covariates: • Hispanic adults SIGNIFICANTLY more like to report their race as Other/DK/Ref : Odds Ratio for Hispanic (Non-Hispanic ref): 150.9 95% C.I. (127.84, 178.12) • Age, family size, residence in a multiracial household, residence in a multiethnic household, region of residence, and degree of isolation were also associated with the likelihood of reporting race as Other/DK/Ref
Study question #2 : Are there differences in race reporting by the type of Hispanic origin subgroup? Model containing all Hispanic adults and adjusting for all covariates: Mexican/Mexican-American: REF Puerto Rican: NS Cuban: 0.2195% CI (0.15, 0.28) Dominican: 1.5395% CI (1.21., 1.92) Central/South American: NS
Study question #3 : Are the factors associated with race reporting the same for all Hispanic origin groups? Type of Hispanic origin SOURCE: Lucas, Arias 2006
Summary of findings • Hispanic adults are far more likely to report their race as Other/Ref/DK than non-Hispanic adults, net of other factors • Controlling for demographic, geographic, household, and SES characteristics, as well as reporting status (self vs. proxy), Dominicans most likely to report race as other, Cubans least likely • Covariates affect Hispanic national origin groups differently – income is a major predictor for Cubans; age for Mexican/Mexican Americans; racial composition of household significant for all groups; differences in direction of association exist
Preliminary conclusions • Race is an extremely complex dynamic for Hispanics • Differences in factors related to race reporting for different Hispanic origin subgroups may reflect the histories of their countries of origin • Hispanic respondents bring to the U.S. race context the histories of their countries of origin – typically not compatible with the U.S. concept of race
Official U.S. Census categories: White Black/African American/Negro American Indian or Alaska Native (write-in for tribal affiliation) Asian Indian Chinese Filipino Japanese Korean Vietnamese Native Hawaiian Guamanian or Chamorro Samoan Other Asian (write-in) Other Pacific Islander (write-in) Some Other race (write-in) Major Folk Racial Terms *: Blanco - White Colorao(a) - Redheaded Rubio(a) - Blond Cano(a) – Blond and fair-skinned Blanco(a) con raja – White with black features Jabao(a) – Fair-skinned with curly hair Trigueño(a) – Wheat colored; light mulatto Moreno(a) – Dark skinned Indio(a) – Indian; brown-skinned with straight hair Café con leche – tan/brown-skinned De color – usually means black Negro(a) – black, rarely used Example: Race in Puerto Rico Source: Partial list from “The Puerto Rican Nation on the Move”, Jorge Duany, 2002; p 238
Next steps • Add 2004 NHIS data (person, household, imputed income data) • Increased sample size for Cuban, Dominican populations • Multinomial logistic regression – explore whether there are differences in the specific race groups reported by the five Hispanic origin subgroups • Assess potential interactions between covariates • Although odds ratios used in this presentation, we will also compute predicted probabilities for race reporting status • Examine data for children separately