Pulsar and GRB Analysis Tools for Enhanced Astronomical Data Interpretation
This comprehensive guide discusses various tools and utilities designed for analyzing pulsar and gamma-ray burst (GRB) data. Key features include pulsar phase assignment, GRB spectral and temporal analysis, and observation simulation tools. The tools facilitate data extraction, exposure calculations, and allow users to visualize instrument response functions (IRFs) and manage lifetimes efficiently. Several user-friendly interfaces, including command line and GUI options, enhance accessibility and usability for researchers. This document provides insights into the standard analysis environment for effective astronomical research.

Pulsar and GRB Analysis Tools for Enhanced Astronomical Data Interpretation
E N D
Presentation Transcript
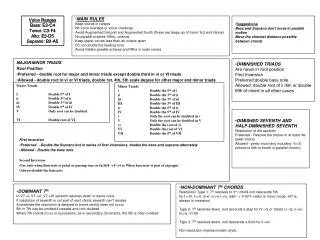
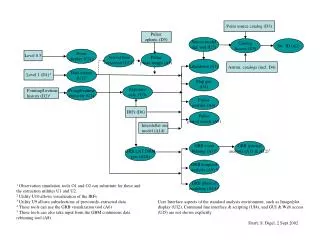
Point source catalog (D3) Pulsar ephem. (D5) Source model def. tool (U7) Catalog Access (U5) Src. ID (A2) Event display (UI1) Level 0.5 Arrival time correction (U12) Pulsar phase assign (A3) Likelihood (A1) Astron. catalogs (incl. D4) Data extract (U1)3 Level 1 (D1)1 Map gen(U4) Exposure calc. (U3) Pt.ing/livetime extractor (U2) Pointing/livetime history (D2)1 Pulsar profiles (A4) IRFs (D6) Pulsar period search (A5) Interstellar em. model (A14) GRB event binning (A7)4 GRB spectral analysis (A11 & A12)5 GRB LAT DRM gen. (A10) GRB temporal analysis (A9) 4 GRB physical modeling (A13)4 1 Observation simulation tools O1 and O2 can substitute for these and the extraction utilities U1 and U2. 2 Utility U10 allows visualization of the IRFs 3 Utility U9 allows subselections of previously-extracted data 4 These tools can use the GRB visualization tool (A6) 5 These tools can also take input from the GBM continuous data rebinning tool (A8) User Interface aspects of the standard analysis environment, such as Image/plot display (UI2), Command line interface & scripting (UI4), and GUI & Web access (UI5) are not shown explicitly. Draft, S. Digel, 2 Sept 2002