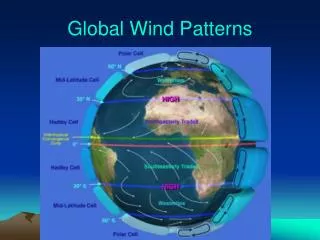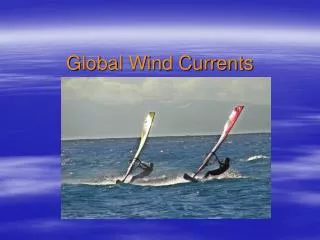
Global wind patterns
Global wind patterns. http://ww2010.atmos.uiuc.edu/(Gh)/wwhlpr/hurricane_globalwinds.rxml?hret=/indexlist.rxml. Hurricane Interior. N 2 780,900 O 2 209,400 H 2 O variable (<20,000) Argon 9,300 CO 2 375 Neon 16 Helium 5.2 Krypton 1 Xenon 0.08.

Global wind patterns
E N D
Presentation Transcript
Global wind patterns http://ww2010.atmos.uiuc.edu/(Gh)/wwhlpr/hurricane_globalwinds.rxml?hret=/indexlist.rxml
N2 780,900 O2 209,400 H2O variable (<20,000) Argon 9,300 CO2 375 Neon 16 Helium 5.2 Krypton 1 Xenon 0.08 Methane 1.0-1.2 NO 0.5 H2 0.5 NO2 0.02 O3 0.01-0.04 Sox 0.002 Typical content of the atmosphere (ppm by volume near the surface)
Atmospheric structure T up to 1500 K due to intense solar radiation Chemical composition changes to be richer in lighter gases, gravitational stratification almost no H2O or ozone T relatively constant, increasing to About 200K at the stratopause Average dT/dh = -6 K/km The region of weather! http://www.mardiros.net/atmosphere/atmosphere_structure.html
Common Pollutants Sometimes called TSP Total volume in the US is about 180Mton/yr: about 3.3lb/day.person Note: this is about HALF of what it was 40 years ago even though the population and economy have grown substantially
Smoke stacks, the first solution http://photovault.com/Link/Industry/IndustrySmokestacks.html
Aerosols http://earthobservatory.nasa.gov/Library/Aerosols/
Temperature Inversion In extreme cases the temperature can actually increase with height. The inversion inhibits convection and as a result, pollutants can concentrate near the ground. http://www.weatherquestions.com/What_is_a_temperature_inversion.htm
Temperature Inversion http://daphne.palomar.edu/calenvironment/smog.htm
Acid rain patterns in the US NOTE: neutral water is pH=7; the lower the number, the stronger the acid.
Schanghai Dec. 1993 http://en.wikipedia.org/wiki/Image:Sha1993_smog_wkpd.jpg
Typical TRACE Impurities in Coal (does not include sulphur, which is not a trace impurity!) • How much lead, mercury, and uranium is emitted per year in the US by power plants burning this stuff?
See also an IU article On coal and limestone: http://www.indiana.edu/~rcapub/v20n3/p9.html http://www.dukepower.com/environment/air/scrubber_diagram.pdf
Global warming: What is the controversy? http://www.junkscience.com/GMT/index.htm Interesting NPR story on recently rejected coal power plant in Kansas http://www.npr.org/templates/story/story.php?storyId=15546026
http://eosweb.larc.nasa.gov/EDDOCS/images/Erb/components2.gifhttp://eosweb.larc.nasa.gov/EDDOCS/images/Erb/components2.gif
Carbon Cycle http://en.wikipedia.org/wiki/Carbon_cycle
Spectrum of Solar radiation at the Earth’s surface H&K fig 6.2 Absorption bands due to gasses like CO2, H2O, CH4 etc. These are the so-called green-house gasses.
Note that total temperature change across several ice ages was only about 12oC or about 22oF. CO2 Concentrations and Temperature Change
Carbon Cycle http://en.wikipedia.org/wiki/Carbon_cycle
Sediments and sedimentary Rocks could account for another 6x10⁷ Petagrams! (www.physicalgeography.net/9r.html) http://www.whrc.org/carbon/ (Woods Hole Research Center)
Ozone in the atmosphere: good and bad 10 ppm ozone at ~ 50 km compared to 40 ppb ozone in the troposphere! http://www.mardiros.net/atmosphere/atmosphere_structure.html
Ozone levels at Halley Bay station (Antarctica) http://www.atm.ch.cam.ac.uk/tour/part2.html
TOMS Satellite movie(Total Ozone Mapping Spectrometer) http://www.atm.ch.cam.ac.uk/tour/anim_toms.html
TOMS Satellite movie(Total Ozone Mapping Spectrometer) http://www.atm.ch.cam.ac.uk/tour/part2.html