Download
1 / 30
300 likes | 319 Views
This presentation provides an overview of the assimilation of stratospheric radiosonde data, including the treatment of radiosonde drift and the impact of gravity waves. It also explores the use of radiosondes as near-reference measurements. The speaker acknowledges the support of various organizations and thanks several individuals for their contributions.

E N D
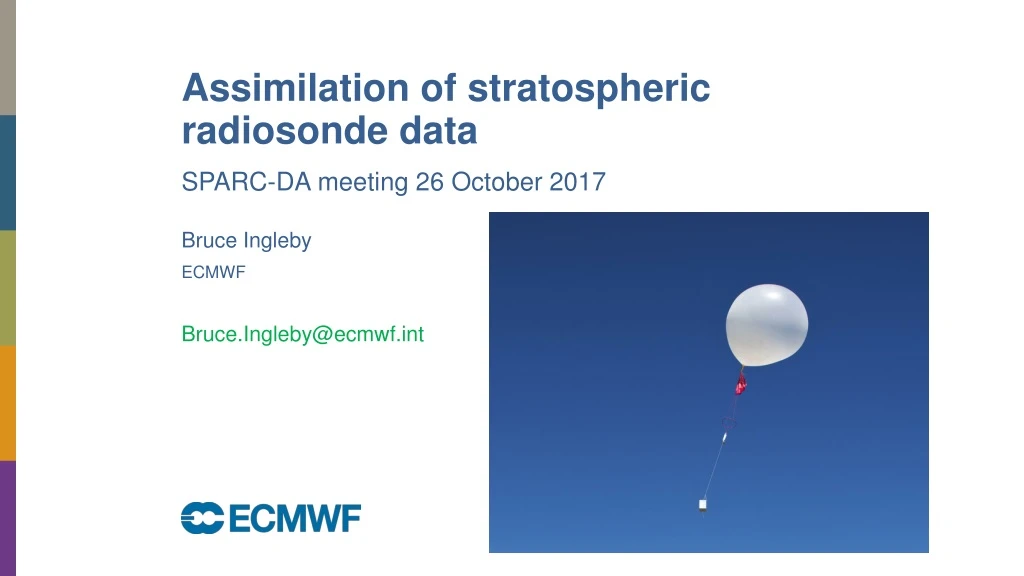
Assimilation of stratospheric radiosonde data SPARC-DA meeting 26 October 2017 Bruce Ingleby ECMWF Bruce.Ingleby@ecmwf.int
Overview • Introduction • Some features of radiosonde data • Treatment of radiosonde drift at ECMWF • What to do about gravity waves? • Radiosondes as (near-)reference measurements • Summary • NB. I am not a stratospheric specialist, I work on assimilation of in situ (radiosonde, surface, aircraft) data European Centre for Medium-Range Weather Forecasts
Introduction and acknowledgements • Work supported by: • Vaisala – looking at different radiosonde types and some experiments • EU H2020 GAIA-CLIM project – using GRUAN and other radiosondes to improve satellite calibration • ECMWF – operational changes • Thanks to Fabien Carminati, David Edwards and Tim Oakley (Met Office), Lars Isaksen and Tomas Kral (ECMWF), Aki Lilja and MattiLehmuskero (Vaisala), Sasha Kats (Roshydromet) and many others. European Centre for Medium-Range Weather Forecasts
Radiosonde drift • Often radiosondes treated as vertical and instantaneous • Can take 2 hours and drift >200 km, figure from Ingleby and Edwards (2015) • Laroche and Sarrazin (2013) found useful improvement to CMC global forecasts from treating drift (calculated from winds) • Met Office and ECMWF (2018) use profile positions as reported in BUFR from some stations • Need to check the positions before using them – a few errors! European Centre for Medium-Range Weather Forecasts
Pendulum motion and wind filtering • Radiosonde swings under the balloon • This adds high frequency noise to the GPS-derived winds – removed by filtering (eg Dirksen et al, 2014, AMT) – red curve shows filtered wind • The noise varies within ascent and from day to day • How much is noise and how much is signal? • Some operational radiosondes seem to over-smooth. European Centre for Medium-Range Weather Forecasts
Radiation: diurnal variation of temperature uncertainty • Dirksen et al (2014, AMT) GRUAN (reference radiosonde) RS92 processing • Their figure 10: --- estimated uncertainty. --- ΔT from dual launches • Uncertainty increases with altitude, especially during daylight (top) – radiation effects (orientation of the sensor) • Diurnal variation can be seen in (O-B) T statistics – more in Z statistics • GRUAN daytime radiation correction differs from Vaisala but net result similar (modified spike removal) • Nighttime radiation correction small, GRUAN uses Vaisala correction European Centre for Medium-Range Weather Forecasts
WMO migration to BUFR data (and high resolution) • Migration supposed to be complete by November 2010 2014 – still going on • Radiosonde data in BUFR: allows high resolution reporting plus time/lat/lon at each level; also extra metadata (eg. software version). • Extra precision in BUFR. Temperatures rounded to 0.2°C in old TEMP code – gives minor temperature offsets (details in ECMWF TM 807). • Currently 28% of radiosonde stations send high resolution BUFR ☺☺, 8% send low resolution native BUFR ☺, 37% send reformatted TEMP , 27% don’t send BUFR • Most reformatted TEMP have parts converted separately – doesn’t meet BUFR coding standard • Progress towards high-resolution, real-time radiosonde reports, Ingleby et al (2016, BAMS). Alsohttps://software.ecmwf.int/wiki/display/TCBUF/ • BUFR data not currently in an open archive : discussions with NCEI and C3S about making the data available European Centre for Medium-Range Weather Forecasts
BUFR and high-resolution report availability September 2017 • HiRes was mainly from Europe, Australia/NZ but others now. US roll-out underway. European Centre for Medium-Range Weather Forecasts
Radiosonde processing and assimilation at ECMWF • Pre-processing for NWP: convert wind, humidity; add uncertainty estimates; interpolate background (~12 h forecast) fields to observation location • Uncertainty includes representativeness differences • ECMWF thin HiResreports to ~350 levels • Bias correction of temperature and humidity (Agusti-Panareda et al, 2009) • Observation (O), Background (B) and Analysis (A) values stored in a database along with QC flags and corrections applied • This is used for daily coverage maps and monthly monitoring statistics • https://www.ecmwf.int/en/forecasts/quality-our-forecasts/monitoring-observing-system • O and B errors assumed uncorrelated, rms(O-B) useful European Centre for Medium-Range Weather Forecasts
Radiosonde drift processing (with Tomas Kral, Lars Isaksen) • Traditionally radiosondes treated as vertical and instantaneous! • Laroche and Sarrazin (2013, W&F) showed positive impact in CMC system of proper drift treatment • For practical reasons ECMWF split the ascent into 15 minute chunks • Minor changes to vertical thinning were made (includes selection of all standard levels) – use up to 3% more levels • Will become operational in early 2018 but there may be further minor changes (e.g. checking drift positions) • Only affects native BUFR reports (that include displacement) European Centre for Medium-Range Weather Forecasts
Example of large drift – 12 UTC 21 November 2016 • Black diamonds – launch, levels to 100 hPa, levels above 100 hPa • French (LoRes) and Polish (just upgraded) BUFR not used at the time 320km European Centre for Medium-Range Weather Forecasts
Mean and rms O-B statistics • Data for Nov 2016 – Feb 2017 • Europe (top), Australia/NZ (bottom) • Assimilated BUFR TEMP standard levels only (to get clean comparison) • Good improvements at 200 hPa and above – including wind biases • More improvement for wind than temperature (less competition) • Improvement comes mainly from better H operator (rather than B) • More drift in the winter hemisphere European Centre for Medium-Range Weather Forecasts
Impact of drift processing • Ascents split into 15 minute chunks versus operation-like control • Vector wind RMS differences verified against own analysis, Nov 2016 – Feb 2017(sample size >220) • Blue means improvement • Short range – much smaller rms in ET stratosphere, mainly due to smaller increments • Less impact on temperature – satellite data • Medium range some improvements in troposphere, especially Southern Extratropics, also seen for Z • Propagation from stratosphere to troposphere? • This is using drift from ~15% of radiosonde stations, bigger impact with more (including tropics) European Centre for Medium-Range Weather Forecasts
Gravity waves in radiosonde and background profiles • Comparison of NWP and observed gravity waves: • Shutts and Vosper, 2011, QJRMS • Reminder that NWP dynamics tends to damp or slow gravity waves – partly to allow use of longer time-steps • Preusse et al, 2014, ACP • Are gravity waves noise or signal for NWP systems? • How does this change with model resolution? European Centre for Medium-Range Weather Forecasts
2015-2015 temperature O-B results (Vaisala RS92) • Statistics on standard levels, split by latitude band. • Bias – dashed, rms –solid. • Cold LS bias in B esp. N of 50°N • Rms differences: • Stratospheric rms larger in tropics than in extratropics – probably due to more gravity waves in tropics (Alexander et al, 2002) • Satellite data shows max in tropics and bigger max at ~50°S downstream from Andes (Yan et al, 2010) • Similar results for other types European Centre for Medium-Range Weather Forecasts
2015-2016 wind O-B • Similar statistics for wind: bias of wind speed (dashed), vector wind rms (solid) • B wind speeds slightly low (0.2 m/s) in general, but larger bias (~ 0.8 m/s vs RS92) in tropical UTLS • Stratospheric rms slightly larger in tropics – gravity waves? European Centre for Medium-Range Weather Forecasts
A temperature example • T profile from Alaska • Black TEMP, Red background • Red Xs– suspect values (cat 1) according to background check • If >3 suspect values in pressure range (~stratosphere) then all values within that range rejected!! • Cat 1 boundary relaxed to reduce this problem European Centre for Medium-Range Weather Forecasts
A wind example • Wind from Kenya • Components plotted separately • Background relatively good for this case European Centre for Medium-Range Weather Forecasts
Cases from Chile for August 2017 • I was looking at Chilean profiles because they had recently started sending high resolution BUFR reports (shown in blue) • Came across various interesting wave cases – some shown • I noted different cases for T and wind (as before) • In a few cases the background is surprisingly good (perhaps slight phase errors) in most cases it is poor European Centre for Medium-Range Weather Forecasts
Temperature cases - Chile < 41°S 53°S > European Centre for Medium-Range Weather Forecasts
Wind cases - Chile 41°S > Easter Island 27°S below European Centre for Medium-Range Weather Forecasts
Possible strategies for treating GWs in NWP • Filter out gravity waves • Try to assimilate statistical properties • Deterministic assimilation • Increase σo and σb? • More chance of right phase for orographic gravity waves? • Of course some satellite data, GPS-RO and hyperspectral sounders, sees gravity waves as well (T but not wind) European Centre for Medium-Range Weather Forecasts
Radiosondes as reference data • Work done as part of EU H2020 GAIA-CLIM project • WP4: using in situ reference data (GRUAN radiosondes) and NWP fields to improve the calibration of satellite data • “GRUAN processor” Fabien Carminati (Met Office) compares reference (GRUAN) data and its uncertainty with background fields from MO and ECMWF • Limited by GRUAN sampling – can we use operational RS92 (+ others) and average/modified GRUAN uncertainty to improve sampling? European Centre for Medium-Range Weather Forecasts
Result from GRUAN processor • 2013 data for Lindenberg (near Berlin) – GRUAN lead centre, typical of Northern Extratropics • Note: B-O! for MetOffice and ECMWF • Red: GRUAN uncertainty • Obvious feature is ECMWF cold bias between 100 and 10 hPa (due to excess water vapour there?) • This is also seen in operational O-B statistics, with slightly lower magnitude • Lower panel: values in ATMS radiance space European Centre for Medium-Range Weather Forecasts
GRUAN vs operational (HiRes) data • Some stations now report HiRes BUFR (often 2 second data) in real time (Ingleby et al, 2016, BAMS) • For RS92 temperature this is almost identical to GRUAN profile • There are slight differences for humidity (Td shown) • ECMWF profile is smoother • The BUFR includes position of each level and extra metadata, but not uncertainty estimates European Centre for Medium-Range Weather Forecasts
Links in traceability/comparison chain • GRUAN vs Vaisala RS92 processing • Operational RS92 data at GRUAN stations vs operational RS92 data at other stations • Extend to other ‘good’ radiosonde types? • GRUAN uncertainties have no dependence on latitude • Background and representativeness uncertainties do depend on latitude • Background and representativeness uncertainties also depend on gravity waves (try to filter these out or modify uncertainties?) European Centre for Medium-Range Weather Forecasts
Future directions for radiosonde reporting • ~800 land stations worldwide • ~170 are designated as GUAN (GCOS upper air network) • At least 25 reports/month should reach 30 hPa • Commitment to long-term operation • GCOS task team set up to look at recommendations for GUAN • May have implications for all stations • Should there be more flexibility about launch times (eg. Local time rather than 00 and 12 UTC)? • Should the 30 hPa guideline be revised? • I am happy to take input on these issues (especially with supporting evidence) European Centre for Medium-Range Weather Forecasts
Summary • Migration to high-resolution BUFR reporting underway • Brings both challenges and benefits • Correct treatment of radiosonde drift improves O-B and forecasts • Stratospheric improvement at T+24 propagates downward • How should we treat gravity waves: noise or signal? …. • Radiosondes are an important reference within NWP • Quality varies by radiosonde type – ECMWF Tech Memo 807 • Need more work on quantifying uncertainties of both radiosondes and NWP European Centre for Medium-Range Weather Forecasts
GUAN and other radiosonde subsets • 15 GUAN stations not reporting in December 2016, esp island/African stations • Some are temporary, but this is typical • GUAN not distinguished in NWP • GRUAN dominated by (now restricted to) northern extratropics – some Australian stns in the pipeline European Centre for Medium-Range Weather Forecasts
hi European Centre for Medium-Range Weather Forecasts