Download
1 / 40
400 likes | 570 Views
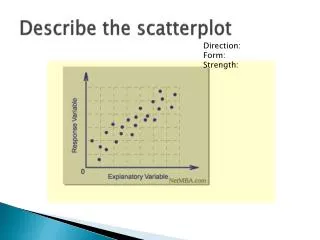
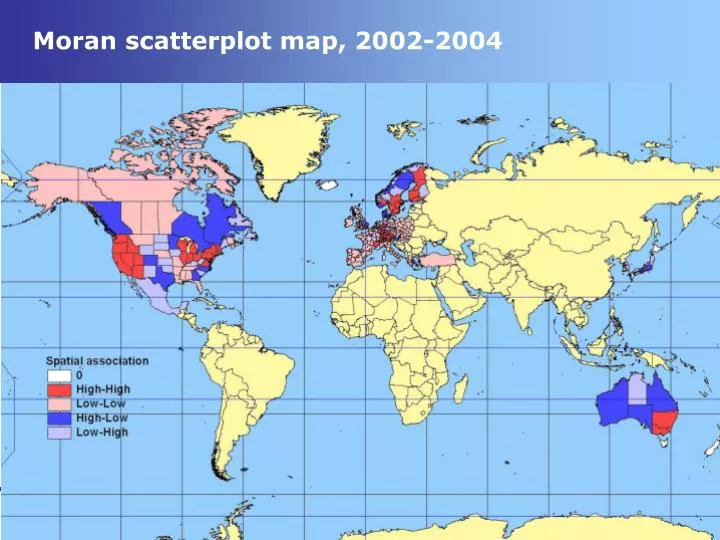
Moran scatterplot map, 2002-2004. Moran scatterplot map Europe, 2002-2004. Moran LISA map, 2002-2004. Moran LISA map Europe, 2002-2004. Convergence in innnovative efforts? National level. Convergence in innnovative efforts? Regional level. Summary of main novelties….

E N D
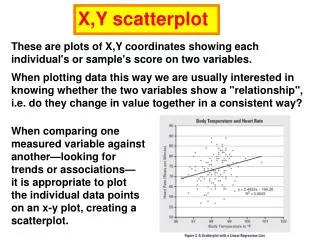
Moran scatterplot map, 2002-2004 Geography of innovation in OECD regions
Moran scatterplot map Europe, 2002-2004 Geography of innovation in OECD regions
Moran LISA map, 2002-2004 Geography of innovation in OECD regions
Moran LISA map Europe, 2002-2004 Geography of innovation in OECD regions
Convergence in innnovative efforts?National level Geography of innovation in OECD regions
Convergence in innnovative efforts?Regional level Geography of innovation in OECD regions
Summary of main novelties… • We focus on OECD regions. • We have a set of homogeneous indicators for all the countries. • We are going to estimate KPF at both the regional level (and later potentially at the industry level) • We are going to use specific econometric techniques to analyse the nature and the spatial scope of knowledge creation and diffusion. Geography of innovation in OECD regions
The determinants of innovative activity at the local level: knowledge production function I = local patents (per capita) in region j • RD= quota of R&D on GDP (j) • HK= tertiary education (j) • DENS= population density (j) • NAT = national dummies; • DU, DR, DCAP= dummies for urban, rural, capital regions • DGDP= dummy for above and below average GDP per capita • Note: • Variables in log • Time lags are considered Geography of innovation in OECD regions
Estimation strategy • OLS to assess significance of coefficients and the presence of spatial dependence • Discriminate between spatial lag model or spatial error model and re-estimate with ML Geography of innovation in OECD regions
Some robustness checks • Interactive dummies: • DGDP*HK and DGDP*RD • Spatial Lag of RD • KPF with distance matrix (only for EU and North America) • KPF including Japan and Korea (estimation of some variables) • KPF with PCT per worker (instead of per capita)
Final remarks • Clusters of regional innovative systems have formed across OECD countries • Main determinants of knowledge creation are at work both at the local and at the external level • Human capital has larger effects than R&D • Such determinants are within national innovation systems Geography of innovation in OECD regions
Final remarks and questions • Clusters of regional innovative systems have formed across OECD countries • Main determinants of knowledge creation are at work both at the local and at the external level • Are they different with respect to industrial specialisation? • Are they within national innovation systems? • Are they getting stronger or bigger? Geography of innovation in OECD regions
The research agenda forwhat we have done so far • There are still some missing values in the database (Korea and Switzerland, for example) • No detail about RD • Public vs private (possible for some countries) • Not all spatial externalities are appropriately measured • Citations can be used to measure spillovers both within and across regions • No measure of other local public knowledge • University and research centers? Geography of innovation in OECD regions
Knowledge flows • Knowledge flows occur when an idea generated by one particular institution is learned by another institution. • The learning process creates the availability of the new idea that becomes part of what is called ‘accessible knowledge’ • Knowledge may flow through at least four different channels: traded goods, labor mobility, transaction-based flows and knowledge spillovers • Channels may be internal or external with respect to firms Intangible assets & regional economic growth
Research line • To provide a review of the main contributions in the literature • To contribute to the analysis of knowledge flows (proxied by citations) across European regions and to investigate on their main determinants • To examine whether geographical distance and spatial contiguity influence knowledge links • To investigate on the evolution of such flows along time • To investigate on specific sector features of such flows • To investigate on cross-border flows Intangible assets & regional economic growth
Knowledge flows • Knowledge flows occur when an idea generated by one particular institution is learned by another institution. • The learning process creates the availability of the new idea that becomes part of what is called ‘accessible knowledge’ • Knowledge may flow through at least four different channels: traded goods, labor mobility, transaction-based flows and knowledge spillovers (depend on organisational, social, institutional and geographical proximity) • Channels may be intra- or inter-firms Intangible assets & regional economic growth
Distribution of citations for country of origin and destination, 1980-2000 Intangible assets & regional economic growth
Distribution of citations for country of origin and destination, 1980-2000
Descriptive statistics (citazioni per capita ) 1985 - 1990 1980 - 1985 1990 - 1995 1995 - 2000 Intangible assets & regional economic growth
Distribution of citations for destination,% on total, 1980-2000 Intangible assets & regional economic growth
Econometricanalysis • An improvement of previous analysis with an original extended database • The analysis is performed with an original econometric methodology applied to spatial data in a gravity model developed by Le Sage and Page (2008). Intangible assets & regional economic growth
Estimation and variables • Our dependent variable is the number of citations originated in region i and received by region j. This flow is measured in two periods: 1990-1995 and 1995-2000. • We consider 219 territorial units (Turkey excluded) • We replicate our analysis for some sectors: two high tech sectors such as Chemicals and Machinery and a set of sectors which we name Traditionals (which include Food and Beverage, Textiles, Apparels, Leather, Woods and Paper). Intangible assets & regional economic growth
Variables • As for the explanatory variables • GDP per capita • Quota of R&D expenditure • Distance in kilometers. • As a robustness exercise we test our results • by substituting the R&D variable with the stock of patents. • to see if there are institutional, structural and cultural determinants affecting knowledge flows across regions national dummies are inserted • Results are also tested with respect to the presence of zero’s Intangible assets & regional economic growth
Period 1990-1994, total citations, regressors GDPpc, R&D Intangible assets & regional economic growth
Period 1995-2000, total citations, regressors GDPpc, R&D Intangible assets & regional economic growth
Period 1995-2000, sector Chemicals Intangible assets & regional economic growth
Regressions: Period 1995-2000, sector Machinery Intangible assets & regional economic growth
Period 1995-2000, sector Traditional Intangible assets & regional economic growth
Period 1995-2000, total citations, regressors: GDPpc, PAT Intangible assets & regional economic growth
Regressions: Period 1995-2000, total citations, regressors GDPpc, R&D, dummy NAT Intangible assets & regional economic growth
Regressions: Period 1995-2000, total citations, regressors GDPpc, PAT, dummy NAT Intangible assets & regional economic growth
Main results/1 • Citations as well as patents are concentrated across space but that a process of slow but gradually progressive diffusion is ongoing. • Clusters of innovative regions appear both at the national and the international level. • There is a lot of heterogeneity among regional flows and that such differences can be related both to diverse geographical, institutional and industrial settings Intangible assets & regional economic growth
Main results/2 • The econometric analysis proves that knowledge flows depend on the weight of origin and destinations regions measured by GDP per capita and R&D investments. • Moreover, knowledge flows depend on geographic distance and on the weights of neighbouring regions both of the origin and the destination regions. • Results are maintained when some robustness exercise is performed. • Finally, sector analysis shows that some results are not robust with respect to the specific feature of the economic structure. Intangible assets & regional economic growth
For your interests • Oecd patent database includes also data on citations regionalised for TL2 regions • If you are interested in this topic and getting hold on the data you can contact me: stefanousai@unica.it Geography of innovation in OECD regions