Download
1 / 24
240 likes | 345 Views
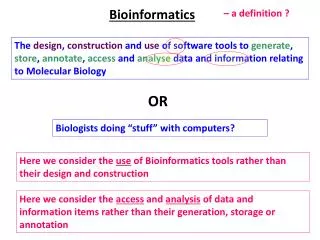
This overview highlights critical areas in bioinformatics, including homology modeling and structural analysis techniques. We explore structure prediction, alignment methods, and the use of tools such as SSEA and Wurst for secondary and tertiary structure predictions. Further, we examine cluster analysis using k-means and density-based methods, followed by phylogenetic analysis of gene families and evolutionary relationships via various methods including maximum likelihood and Bayesian approaches. Key software tools and resources for these analyses are also provided.

E N D
Bioinformatics Richard Tseng and Ishawar Hosamani
Outline • Homology modeling (Ishwar) • Structural analysis • Structure prediction • Structure comparisons • Cluster analysis • Partitioning method • Density-based method • Phylogenetic analaysis
Structural Analysis • Overview • Structure prediction • Structural alignment • Similarity
Tools for protein structure prediction • Protein • Secondary structure prediction: SSEA http://protein.cribi.unipd.it/ssea/ • Tertiary structure prediction: • Wurst: http://www.zbh.uni-hamburg.de/wurst/ • LOOPP: http://cbsuapps.tc.cornell.edu/loopp.aspx
WURST( Torda et al. (2004) Wurst: A protein threading server with a structural scoring function, sequence profiles and optimized substitution matrices Nucleic Acids Res., 32, W532-W535) • Rationale • Alignment: Sequence to structure alignments are done with a Smith-Waterman style alignment and the Gotoh algorithm • Score function: fragment-based sequence to structure compatibility score and a pure sequence-sequence component substitution score • Library: Dali PDB90 (24599 srtuctures)
Tools for structure comparison • Pair structures comparison: • TopMatch • Matras: (http://biunit.naist.jp/matras/) • Multiple structures comparison: • 3D-surfer • Matras: (http://biunit.naist.jp/matras/)
TopMatch (Sippl & Wiederstein (2008) A note on difficult structure alignment problems. Bioinformatics 24, 426-427) • Rationale: • Structure alignment: http://www.cgl.ucsf.edu/home/meng/grpmt/structalign.html • Similarity measurement • Input format • PDB, SCOP and CATH code • PDB structure directly • Exercise: http://topmatch.services.came.sbg.ac.at/
3D-surfer (David La et al. 3D-SURFER: software for high throughput protein surface comparison and analysis. Bioinformatics , in press. (2009)) • Rationale • Define a surface function • Transform the surface function into a 3D Zernike description function • Input format • PDB and CATH code • PDB structure directly • Exercise: http://dragon.bio.purdue.edu/3d-surfer/
Cluster analysis • Goal: • Grouping the data into classes or clusters, so that objects within a cluster have high similarity in comparison to one another but are very dissimilar to objects in other clusters. • Methods • Partitioning method: k-means • Density-based method: Ordering Points to Identify the Clustering Structure (OPTICS)
k-means • Rationale: Partition n observations into k clusters in which each observation belongs to the cluster with the nearest mean • Exercise http://cgm.cs.ntust.edu.tw/etrex/kMeansClustering/kMeansClustering2.html
OPTICS • Rationle: Partition observations based on the density of similar objects • Exercise http://www.dbs.informatik.uni-muenchen.de/Forschung/KDD/Clustering/OPTICS/Demo/
Phylogenetic analysis • Overviews • Comparisons of more than two sequences • Analysis of gene families, including functional predictions • Estimation of evolutionary relationships among organisms
Theoretical tree • Parsimony method • Distance matrix method • Maximum likelihood and Bayesian method • Invariants method
Software • Collections of tools http://evolution.genetics.washington.edu/phylip/software.html • A web server version for tree construction and display • PHYLIP, http://bioweb2.pasteur.fr/phylogeny/intro-en.html • Interactive tree of life, http://itol.embl.de/ • Mostly common used stand alone software • PHYLIP, tool for evaluating similarity of nucleotide and amino acid sequences. http://evolution.gs.washington.edu/phylip.html • TreeView, tool for visualization and manipulation of family tree. http://taxonomy.zoology.gla.ac.uk/rod/treeview.html • Matlab - bioinformatics tool box
Example: Alignment phylogenetic tree of Tubulin family • Searching homologous sequences of Tubulin (PDB code: 1JFF) from RCSB protein databank • Blast for pair sequence alignment • Clustalw for comparative sequence alignment • Evaluating protein distance matrix • using “Protdist” of PHYILIP (Particularly, Point Accepted Mutation (PAM) matrix is used) • Clustering proteins using “Neighbor” of PHYILIP (Neightboring-Joint method is considered)
Example: n-distance phylogenetic tree • Evaluating n-distance matrix • n-distance method • Clustering proteins using “Neighbor” of PHYILIP (Neightboring-Joint method is considered) • 16S and 18S Ribosomal RNA sequenecs of 35 organisms
Summary • Homology modeling • Tools for structure prediction and comparisons • Tools for phylogenetic tree construction Thanks for your attention!!
n-distance method • Frequency count of “n-letter words” • n-dsiatnce matrix • Advantage: • Identify fully conservative words located at nearly the same sites • Effecient MREIVHIQAGQCGNQIGAKFWEVISDEHGIDPTGSYHGDSDLQLERINVYYNE