Download
1 / 17
170 likes | 308 Views
First look to the CTB data. Outline: How to get TileCal data from the CTB A look at TileCal response to muons from 180 GeV pion and electron runs. Sigrid J ø rgensen Roca Atlas-Ifae meeting November 2004. Processed online data:

E N D
First look to the CTB data Outline: How to get TileCal data from the CTB A look at TileCal response to muons from 180 GeV pion and electron runs Sigrid Jørgensen Roca Atlas-Ifae meeting November 2004
Processed online data: Can be found at http://tileinfo.web.cern.ch/tileinfo/lps/CTB/ One can select the run number, trigger type, beam energy, beam particle, SOR time, eta, theta, cherenkov pressure 1 and 2, beam type, run type, beam polarity, number of events, logical file name, logical file size… Around 3% of the runs are availabe on the web.
Downloaded root file: TileRec /h1000: Data from beam line detectors (non Atlas detectors) and TileCal detailed information. TB /Tree: Gives public information about the whole energy and clustering in both calorimeters. CALO /168 (Liquid Argon Calorimeter) /169 (Tile Calorimeter) Data for each cell of TileCal and LAr (energy, eta position…)
TileRec /h1000: Beam line detectors (scintillators, muon wall, trigger, etc) TileCal detailed information (ADC samples, CIS parameters, etc)
Evt: Event number. Run: Run number. Trig: Trigger type (1=phys,2=laser,4=ped,8=CIS) MuBackHit: Number of hits (cells with signal) in Back Muon Wall. MuBack[14]: Signal in the back muon wall. Cispar[12]: CIS parameters MuTag: Signal in Muon Tag scintillator. MuVeto: Signal in Muon Veto scintillator. S1cou: Signal in S1 beam counter. S2cou: Signal in S2 beam counter. S3cou: Signal in S3 beam counter. EneC0[48]: Energy calculated by flat filter. (pC of flat filter) EfitC0[48]: Energy calculated by least-squares fit method. (pC of fit method) TfitC0[48]: Signal timing calculated by least-squares fit method. PedFitC0[48]: Pedestal calculated by least-squares fit method. Chi2C0[48]: Chi2 calculated by least-squares fit method. LarSmp[4]: Energy in the LAr samples. BarSmp[3]: Energy in the TileCal barrel samples. Can Can be found at http://atlas.web.cern.ch/Atlas/SUB_DETECTORS/TILE/testbeam/tb2004/analysis/online_ntuple.descr
TB /tree: Eh_Calo : total energy in TileCal + LAr Eh_EM : total energy in LAr Eh_HAD : total energy in TileCal Eh_PresB : total energy in LAr barrel presampler Eh_EMB[3] : total energy in LAr front, middle, back Eh_Tile[3] : total energy in TileCal samples A, BC, D Eh_TileGap : total energy in Gap (E cells, D4 and C10) We do not know for which one of the clusterring algorithms, but the difference should be small.
Clustering variables : prefix_suffix prefixes : cl_nc: number of reconstructed clusters cl_et: ET of cluster cl_eta: eta of cluster cl_phi: phi of cluster eemb0: energy deposited in barrel presampler cl_eemb1: '' '' in 1st EM barrel sampling cl_eemb2: '' '' in 2nd EM barrel sampling cl_eemb3: '' '' in 3rd EM barrel sampling cl_etileb0: energy deposited in Tile barrel A sampling cl_etileb1: '' '' in Tile barrel BC sampling cl_etileb2: '' '' in Tile barrel D sampling cl_etilee0: '' '' in Tile ext. barrel A sampling cl_etilee1: '' '' in Tile ext. barrel B sampling cl_etilee2: '' '' in Tile ext. barrel D sampling suffixes : em : 3x3 sliding window topo_em : topological clustering in LAr topo_tile : topological clustering in Tile cmb : combined topological algorythm
CALO / 168 and 169: CALO/169: Tile Calorimeter nhit: Total number of cells. ECells[0-134]: Energy in cell i (in Mev, calibrated! ) EtaCells[0-134]: Eta position of cell i. ) PhiCells[0-134]: Phi position. DetCells[0-134]: Code which gives the radial position of cell i. CALO/168: Liquid Argon Calorimeter Same variables, same meaning. DetCells[0-134]: 65 = presampler, 81 = middle, 113 = back.
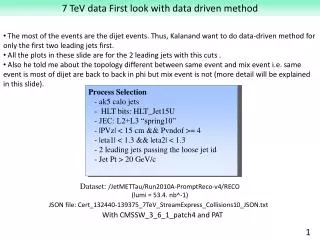
Eta = 0.646 The upper graphic is calculated with ECell from CALO, so the energy is calibrated (GeV/pC = 1.1). Signal Peak =2348 MeV -> 2.583pC. At the below histogram Efit from TileRec (h1000) has been used. The energy is calculated by fit method. Signal Peak = 2.586pC. pC
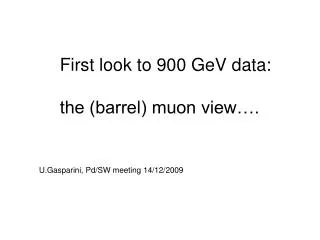
Not processed data: Must be reconstructed into ntuples from tilebeam@pctbmodi.cern.ch. One gets a root file with only the TileRec/h1000 directory with the same data than before. Other root folders produced by LAR people. Below I show 4 plots for 2 different runs corresponding to flat filter and fit method. In the past, the signal from the flat filter method was found to be 9% higher for the 180 GeV muons.
Eta = 0.646 pC pC Signal Peak for fit method = 2.58 pC (remember 2.58) => Perfect agreement between public data and the re-processed on my own data. Signal Peak for flat filter = 2.75 pC The peak difference is 7%, - agrees with the expectations
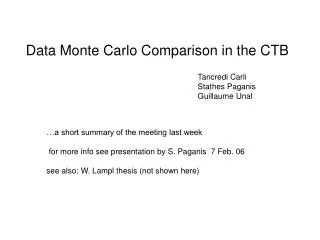
Eta = 0.284 pC pC Signal Peak for fit method = 2.22 pC drops with the material - ok Signal Peak for flat filter = 2.58 pC The peak difference is 16%, somewhat agrees
TileCal response to muon for 180 GeV pion and electron runs Plots oftruncated mean (at 97.5% of the events) and signal peaknormalized to the path length, as function of eta. The upper graph corresponds to energy taken from CALO.The spread for TM is 1.4%, and for MOP, 1.0%. At lower graph I used fit method energy from TileRec directory. Deviation for TM is 4% (that is strange but not deadly) and for MOP, 0.9%. The expected deviations are about 2%.
Summary: One has two ways of getting TileCal CTB data. Only about 3% of the total number of runs are processed (mostly for calorimeter users) and available online. The rest must be reconstructed by the user. The runs we process on our own, have the basic data of beam line detectors and very detailed TileCal information (since the code came from tcal). At the public ntuples one finds extra folders with cluster and cell information of both calorimeters. The relations between the flat filter and fit method, the calibrated and the raw data, are well understood and are in a very good agreement with what was expected. We haven’t looked at the cluster data.