3.6
3.6. WINTERTIME TETHERED BALLOON MEASUREMENTS OF METEOROLOGICAL VARAIBLES AND AEROSOLS IN SUPPORT OF MANE-VU 2004.

3.6
E N D
Presentation Transcript
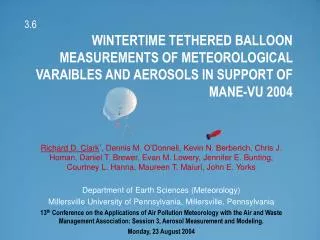
3.6 WINTERTIME TETHERED BALLOON MEASUREMENTS OF METEOROLOGICAL VARAIBLES AND AEROSOLS IN SUPPORT OF MANE-VU 2004 Richard D. Clark*, Dennis M. O’Donnell, Kevin N. Berberich, Chris J. Homan, Daniel T. Brewer, Evan M. Lowery, Jennifer E. Bunting, Courtney L. Hanna, Maureen T. Maiuri, John E. Yorks Department of Earth Sciences (Meteorology) Millersville University of Pennsylvania, Millersville, Pennsylvania 13th Conference on the Applications of Air Pollution Meteorology with the Air and Waste Management Association: Session 3, Aerosol Measurement and Modeling. Monday, 23 August 2004
Introduction • Data Collection • Overview of Winter 2004 • Case Studies • Key Elements • Conclusions • Future Work
Introduction:Why study the wintertime boundary layer? • Studies of the WBL and its chemistry are rare; long-duration aloft measurements are virtually non-existent • Dynamics and thermodynamics are very different than summertime • Synoptic gradients can easily overwhelm local and regional effects, but… • Strong static stability can lead to stratification and a rapid enhancement of local and regional effects • There is a need for high resolution wintertime profiles for modeling comparison and validation
Data Collection • 6 Weeks from 3 January – 14 February 2004 • Lat. 39° 59.43’ N;Lon. 076° 23.16’ W; Elev. 100 m MSL • Class I visibility area in the MANE-VU domain located 16.2 km SW of the Lancaster, PA airport • Semi-rural, agricultural setting typical of the region • Pittsburgh 300 km to the west, New York City 150 km tothe northeast, and Baltimore andPhiladelphia with a 100km radius to the south andeast respectively. Lancaster,PA (pop. 50,000) 9 km east of the site • Representative of the mid-Atlantic piedmont area abouthalfway distant between the Atlantic coastal plain and the Appalachian Mountains
Data Collection: Platforms • Two 12 m3 balloons each with 7.5 kg payload capacity • Blimp (top) used for vertical profiling to 750 m AGL • Balloon (bottom) used for constant altitude time series at designated “altitudes of interest.” 1 2 3 4 5 6 120 profiles 87 hours
Overview of Winter 2004: Climatology From 3 January - 14 February 2004, the site experienced temperature departures of -6.6 F from normal and 9.6 mm above normal precipitation January was the 10th coldest on record in the mid-Atlantic region with a -6 F departure from normal. The month was also drier than normal with only 30% of normal precipitation In February both temperature and precipitation returned to near normal values First half of February temperature was still -2 F below normal and precipitation was twice normal The January thaw was absent in 2004 in the mid-Atlantic region JANUARY FEBRUARY
Overview of Winter 2004: Synoptic Conditions 17 Jan 04 00 UTC • January characterized by progressive wave short pattern • Rapid exchange of air masses • Influx of air from the Canadian Provinces • Coupling of the subtropical and polar jets • Strong baroclinicity
Overview of Winter 2004: Synoptic Conditions 7 Feb 04 18 UTC • Significant pattern change in late January (~ 27th) • Mean trough established in Midwest • Influx of air from south-central US and Gulf of Mexico • Temperature and moisture more seasonal • Strong baroclinicity continues
Case Studies: 2 FEB 2004 Missing CPC/DT
Case Studies: 2 FEB 2004 Missing CPC/DT
Case Studies: 2 FEB 2004 Surface Quantities
Case Studies: 5 FEB 2004 Surface Quantities
Case Studies: 5 FEB 2004 Surface Meteorology