Download
1 / 12
140 likes | 487 Views
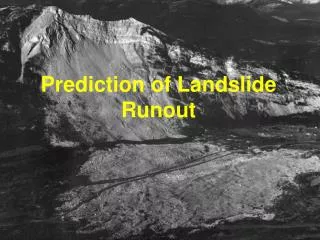
Prediction of Landslide Runout. DAN-W (Pseudo-3D) DAN3D (Hungr, 1995) McDougall and Hungr, 2004). Dynamic models:. Rheologies :. Frictional: . or:. Where Φ b is the “Bulk Friction Angle (modified by pore-pressure. Voellmy :. Calibration: Back-analyse the 1903 event

E N D
DAN-W (Pseudo-3D) DAN3D (Hungr, 1995) McDougall and Hungr, 2004) Dynamic models:
Rheologies: Frictional: or: Where Φb is the “Bulk Friction Angle (modified by pore-pressure Voellmy:
Calibration: Back-analyse the 1903 event Look at smaller rock avalanches in the Canadian Rockies.
Voellmy, f=0.1 ξ=500 m/s2
Jonas Creek landslides (Bruce, 1978) Maximum runout for the south slide (approx. 4 million m3) f=0.15, ξ=500 m/s2
Summary of runout predictions 6.7 million m3 Slide A from the South Peak. Red: Most Likely Purple: Alternative Yellow: Extreme RunoutTurqoise: Piecemeal Detachment
Summary of runout predictions 13.8 million m3 Slide B from the South Peak. Red: Most Likely Purple: Alternative Yellow: Extreme RunoutTurqoise: Piecemeal Detachment
Envelope of Hazard Areas for 12 potential rock avalanches from the South Peak and Third Peak of Turtle Mountain. Full line: 3D analyses. Dotted line: 2D analyses.