Download
1 / 30
340 likes | 699 Views
ASEAN+3 Summer Camp for the Gifted in Science July 22, 2010. About Global Warming and Climate Change. APEC Climate Center. Doo Young Lee. 5. Climate’s come a Long way. 1. 3. 4. 2. Greenhouse Effect. Climate & Weather. What is the Climate System. Climate Change: What it is. 7.

E N D
ASEAN+3 Summer Camp for the Gifted in Science July 22, 2010 About Global Warmingand Climate Change APEC Climate Center Doo Young Lee
5 Climate’s come a Long way 1 3 4 2 Greenhouse Effect Climate & Weather What is the Climate System Climate Change: What it is 7 Major cause of Global Warming 6 The Climate Detectives 8 Modeling the Future of Climate Change 9 Can We Change the Climate? 10 We Can Make a Difference! Contents
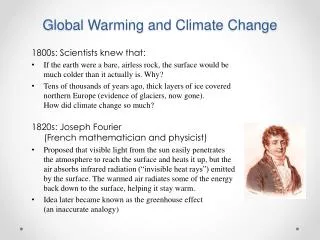
Climate Change: What it is Earth has warmed by about 0.74ºC over the past 100 years. But why? And how? Well, scientists are not exactly sure. The Earth could be getting warmer on its own, but many of the world's leading climate scientists think that things people do are helping to make the Earth warmer Climate Change refers to any distinct change in measures of climate lasting for a long period of time. In other words, “climate change” means major changes in temperature, rainfall, snow, or wind patterns lasting for decades or longer. Climate change may result from: natural factors, such as changes in the Sun’s energy or slow changes in the Earth’s orbit around the Sun; natural processes within the climate system (e.g., changes in ocean circulation); human activities that change the atmosphere’s make-up (e.g, burning fossil fuels) and the land surface (e.g., cutting down forests, planting trees, building developments in cities and suburbs, etc.).
Weatherdescribes whatever is happening outdoors in a given place at a given time. Weather is what happens from minute to minute. The weather can change a lot within a very short time. Climatedescribes the total of all weather occurring over a period of years in a given place. This includes average weather conditions, regular weather sequences (like winter, spring, summer, and fall), and special weather events (like tornadoes and floods). How would you describe the climate where you live? Climate & Weather • Weather is all around us. Weather may be one of the first things you notice after you wake up. Chances are, if it is cold and snowing, you'll wear a jacket when you go outside. If it's hot and sunny, you may wear shorts.
Greenhouse Effect • The greenhouse effect is the rise in temperature that the Earth experiencesbecause certain gases in the atmosphere (water vapor, carbon dioxide, nitrous oxide, and methane, for example) trap energy from the sun. Without these gases, heat would escape back into space and Earth’s average temperature would be about -18ºC colder. Because of how they warm our world, these gases are referred to as greenhouse gases. The greenhouse effect is important. Without the greenhouse effect, the Earth would not be warm enough for humans to live. But if the greenhouse effect becomes stronger, it could make the Earth warmer than usual. Even a little extra warming may cause problems for humans, plants, and animals.
What is the Climate System? • It may seem hard to believe that people can actually change the Earth’s climate. But scientists think that the things people do that send greenhouse gases into the air are making our planet warmer. Components of the climate system, their processes and interactions Atmosphere Ocean Land Ice Biosphere Oceans cover about 70 percent of Earth's surface. Their large mass and thermal properties, enable them to store vast quantities of heat. Oceans buffer and regulate temperature – energy absorbed or lost by the oceans results in a smaller surface temperature change than would occur over land. The atmosphere and ocean constantly exchange energy and matter. The biosphere is that part of Earth's atmosphere, land, oceans that supports any living plant, animal, or organism. It is the place where plants and animals, including humans, live. Large quantities of carbon dioxide are exchanged between the land-based biosphere and the atmosphere as plants take in carbon dioxide and give off oxygen, and animals inhale oxygen and exhale carbon dioxide. The atmosphere covers the Earth. It is a thin layer of mixed gases which make up the air we breathe. This thin layer also helps the Earth from becoming too hot or too cold, much like clothing does for us. Weather systems, which develop in the lower atmosphere, are driven by heat from the sun, the rotation of the Earth, and variations in the Earth's surface. Land covers 27 percent of Earth's surface, and land topography influences weather patterns. For example, the weather in areas covered by mountains can be completely different than the weather in areas where the land is mostly flat. Ice is the world's largest supply of freshwater. It covers the remaining 3 percent of Earth's surface including most of Antarctica and Greenland. Because ice is highly reflective and because of its insulating properties, ice plays an important role in regulating climate.
Accelerating Global Warming in Recent Global mean temperatures are rising faster with time (Top) Patterns of linear global temperature trends over the period 1979 to 2005 estimated at the surface (left) and for the troposphere from satellite records (right). Grey indicates areas with incomplete data. (Bottom) Annual global mean temperatures (black dots) with linear fits to the data. The left hand axis shows temperature anomalies relative to the 1961 to 1990 average and the right hand axis shows estimated actual temperatures, both in ºC. Linear trends are shown for the last 25, 50, 100 and 150 years. The smooth blue curve shows decadal variations, with the decadal 90% error range shown as a pale blue band about that line. The total temperature increase from the period 1850-1899 to the period 2001-2005 is 0.76 ºC +- 0.19 ºC. From IPCC AR4
Coldnights and days DecreaseWarmnights and days Increase Observed trends Observed trends (days per decade) for 1951 to 2003 in the frequency of extreme temperatures, defined based on 1961 to 1990 values, as maps for the 10th percentile: (a) and (b); and 90th percentile: (c) and (d). Trends were calculated only for grid boxes that had at least 40 years of data during this period and had data until at least 1999. Below each map are the global annual time series of anomalies. The red line shows decadal variations. From IPCC AR4
Geographic distribution of linear trends in mean seal level (mm/year) for 1993-2003 This graph shows the change in sea level since 1880 with a rise in sea level of about 18.5 centimeters during the 20th Century. The data used to make this graph come from 23 tide gauge stations that are on land that is geologically stable. The tide gauge data for each year was averaged. The thick black line is an average that shows the trend. Courtesy of Robert A. Rohde/Global Warming Art Project Today, there are large human populations living in coastal areas worldwide that would be affected by rising sea level and the flooding and erosion that it causes. Freshwater supplies could become contaminated with salt water and farmland could become flooded. Many counties are looking for new technologies to protect people from rising seas.
Inland thickening Near-coastal thinning Rates of surface elevation change on the Greenland Ice Sheet Sea Ice extent anomalies (1979-2005) For the Arctic, the trend is decreasing (negative trend), whereas the Antarctic results show a small positive trend. (From IPCC AR4)
Marked increase after 1994 North Atlantic hurricanes have increased with SSTs N. Atlantic hurricane record best after 1944 with aircraft surveillance. Global number and percentage of intense hurricanes is increasing (1944-2005) SST From IPCC AR4
Climate’s Come a Long way • Earth's climate has been changing constantly over its 5-billion-year history. • Sometimes, the climate has warmed so that the oceans have risen and covered much of the Earth. Each of the changes may seem extreme, but they usually occurred slowly over many thousands of years. To learn more about how climate has changed in the past. • Ancient Climate History - Happenings During the Paleozoic Era (545-248 Million Years Ago) - Happenings During the Mesozoic Era (248-65 Million Years Ago) - Happenings During the Cenozoic Era (65 Million Years Ago to Present)
Happenings During the Paleozoic Era (545-248 Million Years Ago) Time: 545 to 248 million years ago Geography: Early in the Paleozoic the continents were far apart, but moving tectonic plates caused continents to move together into one large continent (a supercontinent) called Pangaea. Climate: Glaciers formed 430 million years ago. They may have only lasted one or a few million years. During this time, ice covered the northern part of Africa, which was located over the South Pole.
Happenings During the Mesozoic Era (248-65 Million Years Ago) Time: 248 to 65 million years ago Geography: At the start of the Mesozoic, the continents were all joined together forming one large continent called Pangaea. During Mesozoic time, they pulled apart from one another. Continents move due to plate tectonics. Climate: - The climate most likely remained warm throughout the Mesozoic. - During the last part of the Mesozoic the climate warmed very much. - There is strong evidence that global cooling occurred at the end of the Mesozoic.
Happenings During the Cenozoic Era (65 Million Years Ago to Present) Time: 65 million years ago to today (and continuing) Geography: - The Atlantic Ocean continues to widen - India collided with the Asian continent forming the Himalayan Mountains - In North America, the Rocky Mountains formed and the Colorado Plateau was uplifted. Climate: - Early Cenozoic climate was warm and humid and the climate cooled gradually during the Cenozoic. - During the past two million years, Earth's climate has cooled and warmed over and over again. The cool times are called Ice Ages because large amounts of ice formed on land.
Weather StationsWeather stations help us find out the temperature on the surface of the Earth. Weather stations use special thermometers that tell us the temperature. They can be set up almost anywhere on land. Weather stations also can tell us how fast the wind is moving and how much rain falls on the ground during a storm. Ocean BuoysA buoy is an object that floats on water, and is often used to warn boats away from dangerous places in the ocean or on a river. But some buoys have special instruments on them. These buoys can tell us the temperature and other things about the conditions of the atmosphere. Weather Satellites Humans send satellites into space to travel around the Earth. The satellites send back information to scientists on the ground. Some of the information they give us is about the weather and the Earth’s temperature. The Climate Detectives (Climates of the Past) • Scientists have to think like detectives. They look for clues to help them understand how the world works. Then they investigate the clues to find evidence – real facts that can give them a better idea of what is going on. Here are some of the ways that scientists gather evidence about climate, both past and present: Ice Cores Some scientists who want to find out more about climate study ice for clues. they are studying the ice from glaciers that have been around for a very long time. They cut pieces of ice and look for air bubbles that were trapped in the ice hundreds or even thousands of years ago. Tree Rings You can tell how old a tree is by counting its rings because it grows a new ring every year. Tree rings also can tell us how much precipitation fell each year in the place where the tree lives.
Major Cause of Global Warming All three records show effects of the large and increasing growth in anthropogenic emissions during the industrial era CO2 Glacial-Interglacial Variability CH4 The shading indicates the last interglacial warm periods From IPCC AR4 If climate has always changed, then why are people concerned about global warming? People are concerned because the Earth is warming faster now than it has in the past as more greenhouse gases are released into the atmosphere. Warming is happening faster and life on Earth, including humans, may not have time to get used to the warming planet. The atmospheric concentration of CO2 and CH4 in 2005 exceeds by far the natural range of the last 650,000 years
Various regions of the world all show warming trends over the past 100 years. These graphs compare the observed changes in temperature (black lines) with model results that include only natural climate forcings like volcanic eruptions and changes in solar energy (blue) and model results that use both natural and human caused climate forcings (pink). IPCC 2007: Working Group 1 - AR4
The Urban Heat Island Effect This cross section through a typical city shows how temperatures are usually lower at the urban-rural border than in dense downtown areas. Lisa Gardiner / Windows to the Universe, based on a figure from the Lawrence Berkeley National Laboratory (From http://www.windows2universe.org/earth/Atmosphere/urban_heat.html)
Modeling the Future of Climate Change Some supercomputers can do more than 80 million calculations an hour! How fast could you do your math homework if you had a supercomputer? ORNL's CrayXT5 Jaguar supercomputer Jaguar is a petascale supercomputer built by Cray at Oak Ridge National Laboratory (ORNL) in Oak Ridge, Tennessee, USA. In November 2009, it was named as the world's fastest computer according to TOP500, the biannual list of the world's top 500 supercomputers.
Special Report on Emissions Scenarios (SRES) The Special Report on Emissions Scenarios (SRES) is a report prepared by the Intergovernmental Panel on Climate Change (IPCC) for the Third Assessment Report (TAR) in 2001, on future emission scenarios to be used for driving global circulation models to develop climate change scenarios. The SRES Scenarios were also used for the Fourth Assessment Report (AR4) in 2007. ■ The A1 scenarios are of a more integrated world - Rapid economic growth. - A global population that reaches 9 billion in 2050 and then gradually declines. - The quick spread of new and efficient technologies. - A convergent world - income and way of life converge between regions. Extensive social and cultural interactions worldwide. There are subsets to the A1 family based on their technological emphasis: - A1FI - An emphasis on fossil-fuels - A1B - A balanced emphasis on all energy sources. - A1T - Emphasis on non-fossil energy sources. ■ The A2 scenarios are of a more divided world. - A world of independently operating, self-reliant nations. - Continuously increasing population. - Regionally oriented economic development. - Slower and more fragmented technological changes and improvements to per capita income. ■ The B1 scenarios are of a world more integrated, and more ecologically friendly. - Rapid economic growth as in A1, but with rapid changes towards a service and information economy. - Reductions in material intensity and the introduction of clean and resource efficient technologies. ■ The B2 scenarios are of a world more divided, but more ecologically friendly. - Continuously increasing population, but at a slower rate than in A2 - Intermediate levels of economic development.
From IPCC AR4 - Even if the concentrations of all greenhouse gases and aerosols had been kept constant at year 2000 levels, a further warming of about 0.1°C per decade would be expected - Continued greenhouse gas emissions at or above current rates would cause further warming and induce many changes in the global climate system during the 21st century that would very likely be larger than those observed during the 20th century
Global-scale patterns for each of the three scenarios and time periods B1 Scenario 1.8°C A1B Scenario 2.8°C A2 Scenario 3.4°C From IPCC AR4 Multi-model mean of annual mean surface warming (surface air temperature change) for the scenarios B1, A1B and A2, and three time periods Regions of high latitude in NH, Large change rate of Global Warming
Projections of Future Changes in Climate Precipitation increasesvery likely in high latitudes Decreaseslikely in most subtropical land regions
5 steps in carbon cycle Can We Change the Climate? • It may seem hard to believe that people can actually change the Earth’s climate. But scientists think that the things people do that send greenhouse gases into the air are making our planet warmer. ■ When Do You Send Greenhouse Gases into the Air? Whenever you ... ... you are helping to send greenhouse gas into the air. To perform many of these functions, you need to use electricity. Electricity comes from power plants. Most power plants use coal and oil to make electricity. Burning coal and oil produces greenhouse gases. ■ Other things we do send greenhouse gases into the air too; The trash that we send to landfills produces a greenhouse gas called methane. Methane is also produced by the animals we raise for dairy and meat products and when we take coal out of the ground.
We can Make a Difference! • Climate change may be a big problem, but there are many little things we can do to make a difference. If we try, most of us can do our part to reduce the amount of greenhouse gases that we put into the atmosphere. Many greenhouse gases come from things we do every day. As we have learned, these greenhouse gases trap energy in the atmosphere and make the Earth warmer. ■ Here are some additional ways you can help make the planet a better place! Learning about the environment is very important. There are many good books that will help you learn. You also can look at the Links page to find other good web sites with information about the environment and climate change. Read Save Electricity Bike, Bus, and Walk Whenever we use electricity, we help put greenhouse gases into the air. By turning off lights, the television, and the computer when you are through with them, you can help a lot. You can save energy by sometimes taking the bus, riding a bike, or walking. .
We can Make a Difference! Talk with your family and friends about climate change. Let them know what you’ve learned. Talk to Your Family and Friends Plant Trees Recycle Some Things to Think About Solar Energy Planting trees is fun and a great way to reduce greenhouse gases. Trees absorb carbon dioxide, a greenhouse gas, from the air. Recycle cans, bottles, plastic bags, and newspapers. When you recycle, you send less trash to the landfill and you help save natural resources, like trees, oil and elements such as aluminum. Did you know that you can help the environment if you buy recyclable products instead of non-recyclable ones? Look for the recycle mark – three arrows that make a circle – on the package Solar energy (a fancy way of saying energy that comes from the sun) can be used to heat homes, buildings, water, and to make electricity.