Download
1 / 32
320 likes | 339 Views
Learn how to maximize sensitivity in 2D gel proteomics using techniques such as sample fractionation, fluorophores, and optimized instrumentation. Explore the structure, function, and proteomic profiling of mitochondria.

E N D
Mitochondria, a Paradigm for Proteomics Automation in 2D Gel Proteomics How to increase Sensitivity? Klaus Herick
Content • Introduction • Definition Proteomics • Process Overview and Flow Path • Proteomics and Drug Discovery • How to increase sensitivity? • Sample Fractionation • Example Mitochondria • Utilise Fluorophores and optimised instrumentation • SYPRO Ruby • ProXPRESS Proteomic Imaging System • InvestigatorTM ProPic Protein Picker
Proteome - The Definition • “The total PROTEin complement of a genOME.” • M. Wilkins et al. Electrophoresis 1995, 16, 1090-1094 • Proteome describes the complete set of proteins that is expressed, and modified following expression, by the entire Genome in the lifetime of a cell. • With less universal sense it describes the complement of proteins expressed by a cell at any one time. • Proteomes are dynamic. • Proteomics is the study of protein properties on a large scale to obtain a global, integrated view of disease processes, cellular processes and networks at the protein level.
C. elegans Age related protein differences old old young young Processes in Proteome Analysis • Proteome Expression or Profiling • identifying which proteins change levels of expression in response to certain stimuli or the environment of the cell • Sensitivity • Dynamic range • Detector linearity • quantitation is key • Proteome Mapping • assigning the location of a protein (-spot), as defined by pI and MW, and identification by mass spectrometry • Sensitivity of spot detection • Resolutions and Sensitivity of MS • sample preparation is key
Proteomics applications Search for therapeutic with optimal efficiency, selectivity & pharmacological profile. Generation of working hypothesis. Basic and exploratory research. Experimental characterisation of proteins as candidates in disease process. Discrimination of valid and non-valid biol. targets of relevance in disease. HTS assays / compound screening. Profiling therapeutic protein leads. Lead identification & optimisation Target identification & validation Basic research Genome etc. Hit TOX POC Cell Map Proteomics Expression Proteomics …. In the Drug Discovery Process
Proteomics 2D Gel Flow Path 2D Gel Electrophoresis Staining Image capture Protein Digestion Feature Excision Image Analysis Audit trail (Protein WarehouseTM) Identification MS Preparation MS Analysis
How to Increase Sensitivity in Proteomics? • Increasing amounts of low-abundance proteins relative to other proteins by fractionation • narrow range pH gradients • high load • solubility during separation • cell compartments • mitochondria • peroxisomes • nuclei • biochemical pre-fractionation • solubility • affinity • Increasing sensitivity by using fluorophores • Increasing amounts of low-abundance proteins relative to other proteins by fractionation • narrow range pH gradients • high load • solubility during separation • cell compartments • mitochondria • peroxisomes • nuclei • biochemical pre-fractionation • solubility • affinity • Increasing sensitivity by using fluorophores
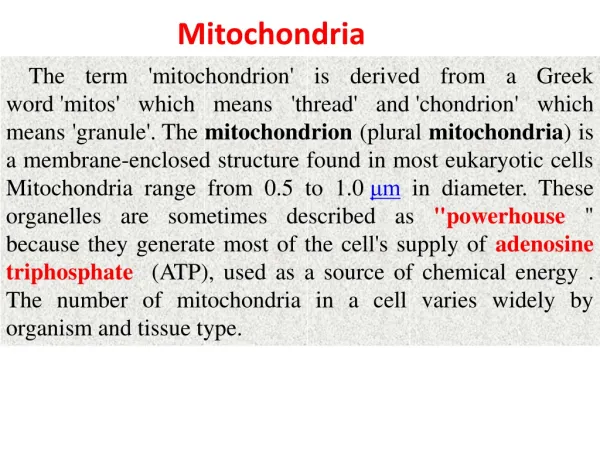
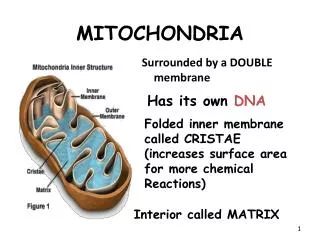
Mitochondria: Structure, Function, Overview • Structure • outer, permeable membrane • inner, non permeable membrane forming cristae • innermembrane space • matrix • Function • synthesis of ATP and reducing equivalents • protonmotive force • Kreb’s tricarboxylic acid cycle • cell signallling • modulation of internal Ca(II) homeostatis • biosynthesis • heme • degradation • urea cycle • cell death • apoptosis and necrosis
Why are Mitochondria a Paradigm for Proteomics? • Simultaneous examination of • entire pathways • multiple enzymatic complexes • to contribute to disease understanding • Genome studies • 1.500 distinct mitochondria encoded proteins (rat liver) • nuclear encoded genes • heterogeneous genome • multiple isoforms possible
Profiling the Mitochondrial Proteome • Silver-stainedReference 2D gel • unfractionatedproteins • average of 1.500 spots per 2D gel • poor recovery from in-gel digestion • limited throughput of profiling effort • 195 (marked) spots excised and processed • not all could be identified • low recovery of peptides • low abundance • lack of credible hits in databases • CBB-stained Reference 2D gels • 8-16 times less sensitive than silver • average of 300 - 500 spots per gel • good recovery from in-gel digestion • MS compatibility Acidic proteins left high molecular weight top CBB = CoomassieTM Brilliant Blue
Identification of over 100 proteins • in several days • high confidence • based on high mass accuracy (typically 50 ppm or less • at least 4 peptides matched • at least 10% sequence coverage Profiling the Mitochondrial Proteome
Pre-fractionation by minispin columns • Metal chelate IMAC column • calcium-charged metal chelate • enrichment of Calcium binding proteins • Concanavalin A (Con A) column • Con A lectin binds high mannose oligosaccharides • Phenyl Sepharose column • hydrophobic protein binding • much less specific enrichment as above
Calcium binding protein enrichment • CBB-stained 2D gel • 819 proteins detected • presumably detected proteins • calcium binding proteins • regulated by calcium • identified spots are marked • proof by MS identification • all proteins are previously shown to bind calcium or to be calcium-regulated Acidic proteins left high molecular weight top
Con A binding protein enrichment • CBB-stained 2D gel • min. 78 proteins detected • presumably detected proteins • glycosylated proteins • large amount of protein unresolved • vertical & horizontal streaking • possible reasons • heterogeneity in charge & mass of putative glycosylated proteins • clear resolved and identified spots are marked • little information available on on glycosylation of mitochondrial proteins • e. g. Glutamate DH identified Acidic proteins left high molecular weight top
Hydrophobic protein enrichment • CBB-stained 2D gel • 736 proteins detected • presumably detected proteins • hydrophobic & membrane proteins • less specific • well-resolved 2D gel • fragment of matrix proteins • no identification by database query • despite excellent spectra and mass accuracy • new proteins? Acidic proteins left high molecular weight top
Table 2. Selected proteins identified in affinity enriched 2-D gels of Mitochondrial and ER and peroxisomal proteins. Affinity ligand Spot number Figure Protein identity Database Accession number calcium 7 3 GRP 78 Swiss Prot P06761 calcium 17 3 Calcium transporting ATPase, ER Swiss Prot P11606 calcium 34 3 ATP synthase beta subunit NCBInr.32499 1374715 calcium 36 3 Aldehyde DH preprotein NCBInr.32499 118505 calcium 52 3 Electron transfer flavoprotein, alpha Swiss Prot P13803 calcium 54 3 Electron transfer flavoprotein alpha Swiss Prot P13803 calcium 66 3 ATP synthase D Swiss Prot P31399 calcium 67 3 ATP synthase alpha Swiss Prot P15999 calcium 78 3 Cytochrome b5 GenPept.11299 AF007107 Con A 11a 4 Methylmalonate-semialdehyde DH Swiss Prot Q02253 ConA 11b 4 Glutamate DH precursor Swiss Prot P26443 ConA 11c 4 Aldehyde DH precursor Swiss Prot Q13573 ConA 22 4 Acyl-CoA DH precursor Swiss Prot P15651 Con A 25 4 D-beta-hydroxybutyrate precursor Swiss Prot P29147 ConA 26 4 Rhodanese fragment Swiss prot P24329 ConA 30 4 Pyruvate DH kinase precursor Swiss Prot Q15118 Phenyl 14 5 Mitochondrial matrix P1 precursor Swiss Prot P19227 Phenyl 15 5 ERP60 Swiss Prot P11598 Phenyl 16 5 Mitochondrial matrix P1 precursor Swiss Prot P19227 Phenyl 19 5 Aldehyde DH precursor Swiss Prot P47738 Phenyl 36 5 3-ketoacyl-COA thiolase Swiss Prot P13437 Phenyl 39 5 Catalase, PX Swiss Prot P00761 ER = Endoplasmic reticulum PX= peroxisome Protein Enrichment by Specific Fractionation
Total Mitochondria 300 to 500 proteins CBB-stained gels 1598 proteins silver-stained gel 300 to 500 proteins Pre-fractionation 819 proteins/ CBB stained calcium binding protein enrichment min. 78 proteins / CBB stained con A binding protein enrichment resolution 736 proteins / CBB stained hydrophobic protein enrichment fragmentation min. 1633 proteins Protein Enrichment by Specific Fractionation More than 3 to 5 times more proteins detected using pre-fractionation!
Overall sensitivity of used process • Approximately 125 fmol of protein in the gel spot!!! • ability to recover sufficient peptides to allow a search and identification in the databases • protein dependend • routine base experiments 250 to 500 fmol in gel spot • date of experiments 1999 • How to increase this further on? • Where are we today?
Increase Sensitivity by.... • ... Using fluorophore-staining AND appropriate instrumentation, because sensitivity is a result of both! • SYPRO Ruby stain • performance in comparison to silver and CBB • new ProXPRESS proteomic imaging system • exact quantitation of fluorophores • expression profiling • new ProPic high-performance protein picker • imager, analysis software and picker in one • on-board in-gel fluorophore detection • proteome mapping • The PerkinElmer Proteomic product line has been optimised for fluorophore staining!
SYPROTM Ruby Stain Vs Silver Stain: Phosphorylase Serial Dilution: Peptide Matches by MALDI-TOF MS • Conclusion: • Peptide mass profiling is feasible using either stain, when 40 ng is available. • Only SYPROTM Ruby stain allows identification with <10 ng of protein.
Features & Benefits of ProXPRESS Proteomic Imager • Superior detection and quantitation over a wide dynamic range • 1 ng protein besides 1 µg protein, SYPRO Ruby stained • special designed -35C cooled, 16 bit CCD camera • 50 µm sample resolution for statistical significant data generation • reliable and repeatable detection (almost no bleaching) • One system for all applications • fluorescence, multi-colour fluorescence, luminescence, absorbance (CBB) densitometry (silver) • multi-label capability • e.g. Cyanine or Alexa dye series in one sample! • continually adapt to the rapidly evolving portfolio of fluorescent dyes and applications • Tomorrow’s technology, today • flexible illumination, top, bottom and edge • essential for multi-colour differential protein expression analysis • powerful VIS (380 to 750 nm) and UV (366 nm) excitation • infinite selection of both excitation and emission wavelengths • any dye today and tomorrow
1000 /400/100/40 /10 / 4 / 2 / 1 ng SYPROTM Ruby labelled Gels imaged on ProXPRESS 2D gel courtesy Novartis Pharma
ProXPRESS: Filters match Dyes for Multi-Colour Measurement Cyanine 2 Cyanine 3 Cyanine 5
ProPic Features & Benefits: “3 in 1” • 1. Gel Imaging • high resolution CCD camera • 12 bit data • UV and white light trans-illumination • SYPRO Ruby, silver CBB, (light tight enclosure) • 2. Image Analysis Software HT Analyzer • single or network licences • 3. Spot excision • On-board direct picking of silver, CBB, SYPRO Ruby-stained gels • Blind picking, i.e. import of files from external imaging systems, e.g. ProXPRESS • Spot selection • database query • manual, i.e. point, click and cut • Accurate and precise excision • centre of gravity picking • 100 µm accuracy • 1.2 and 1.8 mm diameter gel plugs • 120 spots per hour, 768 spots excised unattended (6.5 hours) • Gel plug storage • 8 x 96 well output plates, compatible to ProGest in-gel digestion robot • Gel format • 23 x 27 cm • Excision tool cleaning • no carry over
Before picking After picking SYPROTM Ruby labelled Gels imaged and picked on ProPic Section of SYPRO Ruby-2D gel, magnified Courtesy S. Ozanne and N. Martenesz, Dept. of Clinical Biochemistry, University of Cambridge, UK
Automated Proteome Analysis - Summary • No other separations method can deliver the resolution of 2D gels in a similar time frame • 2D gels offer a simultaneous display of thousands of proteins • 2D gels are quantitative • Post-translational modifications are evident in 2D gels • Automation enables HT • Increased sensitivity by • enrichment of low abundance proteins • using fluorophore-staining and optimized instrumentation • 2D Electrophoresis, Fluorescence Staining and mass spectrometry - a powerful combination!
Acknowledgements • Grant Cameron Genomic Solutions, Ltd. • Peter Jackson PerkinElmer Life Sciences, Ltd. • Mary Lopez Proteome Systems, Inc. • Carole Spibey PerkinElmer Life Sciences, Ltd. The Mitochondria Data are published at: Electrophoresis 2000, 21, 3427 - 3440 High-throughput profiling of the mitochondrial proteome using affinity fractionation and automation Lopez, M.F., Kristal, B.F., Chernokalskaya, E., Lazarev, A., Shestopalov, A.I., Bogdoanova, A. and Robinson, M.