Atmospheric
Atmospheric. Circulation. Air Pressure Experiments Lessons from Paper Cup experiment: 1. Air pressure is present everywhere Air “tries to” move from an area of higher pressure to an area of low pressure Lesson from Pop Bottle experiment: 3. Warm air occupies more space than an

Atmospheric
E N D
Presentation Transcript
Atmospheric Circulation
Air Pressure Experiments • Lessons from Paper Cup experiment: • 1. Air pressure is present everywhere • Air “tries to” move from an area of higher • pressure to an area of low pressure • Lesson from Pop Bottle experiment: • 3. Warm air occupies more space than an • equal number of molecules of cold air
Wind Power Generation in Southern Alberta
The speed and direction of wind • is determined by three forces: • Pressure Gradient Force • Inertial Coriolis Force • Friction Force
Pressure Gradient Force Definition: The difference in atmospheric pressure per unit distance PGF acts at right angles to isobars of equal pressure H L 102.2 99.8 101.4 100.6 600 km Pressure Gradient Force = 2.4 kPa / 600 km = 0.4 kPa / 100 km
Where is the PGF forecast to be strongest today ? Regina or Lethbridge? Solution: Check the spacing of the isobars of equal surface pressure Source:http://weatheroffice.ec.gc.ca/data/model_forecast/592_100.gif
The Inertial Coriolis Force Objects moving in an “absolute” straight line between two points on the Earth’s surface are deflected: To the RIGHT in the N hemisphere To the LEFT in the S hemisphere Why ? The Earth rotates more quickly at the equator.
Visualizing the Coriolis Force Source: NASA
The Friction Force Surface roughness decreases wind speed Reduces impact of Inertial Coriolis Force Winds cross isobars, spiralling out of ANTICYCLONES (H), and into CYCLONES (L) H L
Can you infer wind direction and relative speed from this map ? weather.unisys.com
Sea level pressure: Altitude Correction Source: Ahrens (1994)
Weather symbols and wind barbs
Classic Low Pressure System In Temperate Latitudes 0600h GMT APRIL 5 2003 NORTH- EAST WINDS SHARP COLDFRONT WARM, MOISTSOUTHERLYFLOW www.atmos.washington.edu
Warm Front • Not as steep a division as in a cold front • It takes longer to scour out surface air • (warm air rises)
The weather pattern last September COOL NW WIND WARM FRONT WARM, SOUTHWIND COLD FRONT HURRICANE ISABEL
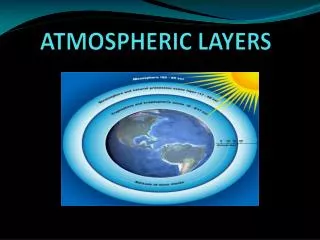
Atmospheric Circulation Main Low and High Pressure Zones • Equatorial Low Pressure Trough • Subtropical High Pressure Cells • Subpolar Low Pressure Cells • 4. Weak Polar High Pressure Cells
Atmospheric Circulation Overview POLARCELL FERRELCELL HADLEYCELL
Equatorial low pressure trough (warm, wet) High solar angle Consistent daylength Convergence Heating ITCZ shifts with season
Hadley Cells • 1. Warm, moist air rises in equatorial low • Cools, condenses, and causes heavy rain • Outward flow to subtropical high at high • altitude • Air descends in subtropical high • Heats, compresses and becomes very dry • The subtropical high provides the gradient • for trade winds and westerlies • eg. Bermuda/Azores and Pacific/Hawaii highs
Ferrel Cells Between subtropical highs and subpolar lows Poleward transport of excess heat through eddies and migration of lows toward polar front Strong low pressure develops in a belt around Antarctica, near the Aleutians and near Iceland Lows strongest in winter (shift and diminish periodically, especially in the summer) Why ?Water much warmer than land in winter leading to lower pressure over oceans
H L Air tends to be unstable in low pressure (tendency to rise) Air tends to be stable in high pressure (tendency to fall) (more on stability in next class)
WINTER SUMMER Generalized Overview of Seasonal Surface Pressure
Average Global Surface Pressure in January and July Can you explain the monsoon season of the Indian sub- continent with this chart ?
Polar High Pressure Cells Tendency for higher pressure near poles than at the polar front Anticyclonic flow develops Weak and variable polar easterlies result (stronger in southern hemisphere) In northern hemisphere winter, the polar front usually lies over Canada and Russia, (further south than in the summer)
Geostrophic Winds 500 mbar height map Lower heights where air is cold Airflow parallel to isobars in upper troposphere Why ? Combination of PGF and Coriolis force Source:http://weatheroffice.ec.gc.ca/data/model_forecast/134_100.gif
Effect of Air temperature on 500 mb heights Source: Ahrens (1994)
Upper Atmospheric Circulation Jet Streams A band of wind in the upper troposphere 150 – 500 km wide 0.9-2.2 km thick Speeds may exceed 300 km/h Polar Jet Stream: Between Polar and Ferrel cells Subtropical Jet Stream: Between Hadley and Ferrel Cells
Jet Stream Cross Section “Rivers” of strong wind where cold and warm meet 18 000 m 12 000 m Tropopause height 6 000 m Discontinuity or step in tropopause height See: www.avsim.com/avwx/avsim_wxus_jetstream.html
Polar Jet Stream Meanders from 30-70° N or S Moves more poleward in summer Influences (and is influenced by) storm paths Subtropical Jet Stream Meanders from 20-50° N or S May occur simultaneously with Polar Jet in NA
Rossby Waves The polar jet stream follows the Rossby Waves Rossby Waves are undulations in the upper-air westerlies extending from the middle to upper troposphere Form along the polar front Mechanism of poleward heat transport
Night Source: Ahrens, 2001
Mountain Valley Breezes Daytime The sun heats the hillslope, causing air to move up the slope Night Night radiation cools the slopes Cooler, denser air moves downslope Source: http://apollo.lsc.vsc.edu
Chinook Winds Cooling At MALR 6°C/km Warming At DALR 10 °C/km Warming At DALR 10 °C/km Cooling At MALR 6°C/km Cooling At DALR 10 °C/km X X VANCOUVER LETHBRIDGE 12°C 8°C More sensible heat
Oceanic Circualtion • Water piles up around equator due to trade winds • Along western edge of oceans, water spills N and S • along shorelines of continents (also downwelling) • Upwelling occurs near east edge of oceans (west coasts)
The Thermohaline Circulation (1) Intensive cooling at the ocean surface in North Atlantic (2) Northward transport of salty surface water from lower latitudes (both increase the density).
El Nino Southern Oscillation Interannual climatic variability at the global scale Caused by changing atmospheric and oceanic circulation in the tropical Pacific Ocean