
Bivariate Data Analysis
E N D
Presentation Transcript
Bivariate Data Analysis Bivariate Data analysis
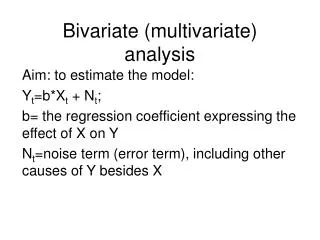
Basically we need to find an equation of a straight line that may model the relationship. The gradient of the line gives us a rate i.e. the ‘y’ units per ‘x’ units e.g. the grams of fat per gram of protein. (Note: We do NOT say “a 1 unit increase in xresults in a change of b units in y”(where b is the gradient) This encourages causal thinking. Beware.
Quote“All models are wrong - but some are useful”George Box, famous statistician
When the data points lie exactly on a straight line… This equation describes the relationship between the variables x and y
Going Crackers! • Do crackers with more fat content have greater energy content? • Can knowing the percentage total fat content of a cracker help us to predict the energy content? • If I switch to a different brand of cracker with 100mg per 100g less salt content, what change in percentage total fat content can I expect?
Common Cracker Brands 380 430 480 530 Energy (Calories/100g) The energy content of 100g of cracker for 18 common cracker brands are shown in the dot plot with summary statistics below. Based on the information above, my prediction for the energy content of a cracker is _____?_______ Calories per 100g
Common Cracker Brands 380 430 480 530 Energy (Calories/100g) The energy content of 100g of cracker for 18 common cracker brands are shown in the dot plot with summary statistics below. Based on the information above, my prediction for the energy content of a cracker is about 449 Calories per 100g
Another quantitative variable which could be useful in predicting (the explanatory variable) the energy content (the response variable) of 100g of cracker is _______
Another quantitative variable which could be useful in predicting (the explanatory variable) the energy content (the response variable) of 100g of cracker iscarbohydrate content.
The Consumermagazine gives some nutritional information from an analysis of these 18 brands of cracker. Some of this information is shown in the table below:
What do I see in these scatter plots? The data suggests a linear trend Positive association The data suggests constant scatter Appears to be a strong relationship No outliers No groupings Response variable Explanatory variable
What do I see in these scatter plots? • The data suggests a linear trend • Positive association • The data suggests constant scatter • Appears to be a moderate relationship • No outliers • No groupings
What do I see in these scatter plots? • No obvious trend overall • Suggestion of two groups (about 30 or less AND about 50-60 crackers per pkt) • No outliers
From these plots, the best explanatory variable to use to predict energy content is ________________________ because _____________
From these plots, the best explanatory variable to use to predict energy content is total fat contentbecausethe relationship is stronger (less scatter) so I can make more reliable predictions.
Roughly, my line predicts the energy content for a cracker with a 10% total fat content is about ___?____ Calories
Roughly, my line predicts the energy content for a cracker with a 10% total fat content is about 440 Calories
Which Line? Which line?
Balancing errors • Errors are the vertical distances between the points and the fitted straight line. • The errors can be marked on a scatterplot using error bars. • The aim is to balance the sum of the error bars above the line with the sum of the errors below the line.
The Least Squares Regression Line Minimise the sum of squared prediction errors Minimise
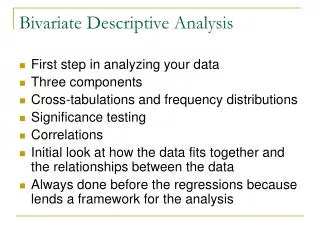
The scatter plot is the basic tool for investigating the relationship between 2 quantitative variables. Check for a linear trend – never do a linear regression without first looking at the scatter plot
Problem: How does the total fat content of a 100g of cracker change with a 100mg decrease in salt content? Use the template on page 34 and 35 to answer this question.
Four scatter plots with fitted lines are shown below. The equation of the fitted line and the value of R2 are given for each plot.
Comment on any relationship between the scatter plot and the value of R2. What do you think R2 is measuring? The smaller the scatter about the trend line, the greater the value of R2.
So what does R2 measure? In a nutshell, it is a measure of how well a model fits the data.
When we ask how well the model fits, we’re really asking how much of the data is still in the residuals.
We can writeData = Model + ResidualorResidual = Data - Model
The difference between the observed ‘y’ value and its associated predicted ‘y’ value is called the residual. The residual at each data value tells us how far off our prediction is at that point.
For linear regression, the errors should be normally distributed
= the fraction of the variance that is accounted for by the model
Fitted line Look at the scatter plot below. What do you notice?
The points lie in a perfect straight line.Correlation coefficient, r = 1Fitted values = observed values
Distribution of y-values Distribution of fitted y-values Shows variation in fitted y’s Shows variation in y’s
Regression relationship = Trend + scatter No scatter
The variability in the fitted values is exactly the same as the variability in the observed values. The fitted line explains all of the variability in the observed values. • There is variability in the x-values, so we expect variability in the fitted values.
There is no linear relationship. Fitted Line
Regression relationship = Trend + scatter Variability in y-values No variability in fitted values
The variability in the residuals is exactly the same as the variability in the observed values.