Download
1 / 49
490 likes | 914 Views
Quantitative traits are continuous characters. Variation in continuous characters is due to a number of loci each of which have a small yet variable effect. Quantitative genetics attempts to characterize quantitative traits in terms of:. The number of loci affecting a character. The average gene act

E N D
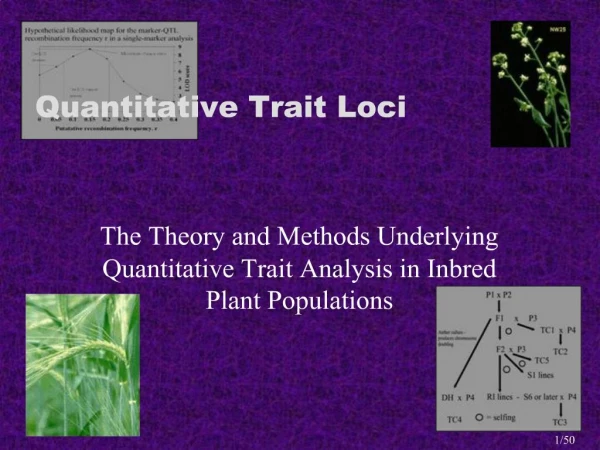
1. The Theory and Methods Underlying Quantitative Trait Analysis in Inbred Plant Populations
2. Quantitative traits are continuous characters. Variation in continuous characters is due to a number of loci each of which have a small yet variable effect. Quantitative genetics attempts to characterize quantitative traits in terms of: The number of loci affecting a character
3. Quantitative trait locus (QTL) The term quantitative trait locus (QTL), refers to a locus underlying a quantitative character.
4. Quantitative trait locus (QTL) The term quantitative trait locus (QTL), refers to a locus underlying a quantitative character.
5. The basic theory of QTL mapping is to score a population for a trait according to the marker genotype. Statistics are then used to identify differences associated with the markers and the trait of interest. QTLs have the following characteristics: They individually follow mendelian rules
7. The study of QTLs relies on the availability of segregating markers that can be used to divide up the population. The availability of markers limited QTL research before the emergence of DNA markers such as: Restriction fragment length polymorphisms (RFLPs)
9. QTL analysis can be classified by the type of progeny used. All of the different progenies are derived from the same reference population, produced by crossing two inbred lines, shown below:
10. From this reference population seven progenies are produced, with different uses, in different QTL analysis techniques. The derivation of these progenies is shown below:
12. The conditional probability that the QTL genotype can be deduced from the known marker genotypes, is the basis on which QTL analysis operates. The conditional probability equation is shown below:
13. It is possible to calculate the conditional probability in an F2, from: The conditional probability equation
15. There are three basic techniques used in QTL analysis: Single point analysis � uses one marker at a time
17. In the point analysis framework, there are four techniques that have been developed: Simple T-test analysis
19. This method uses the simple students T-test to evaluate the presence of a QTL, through statistical differences between marker genotypes. The T-test can only be used in experimental designs where two marker genotypes are present.
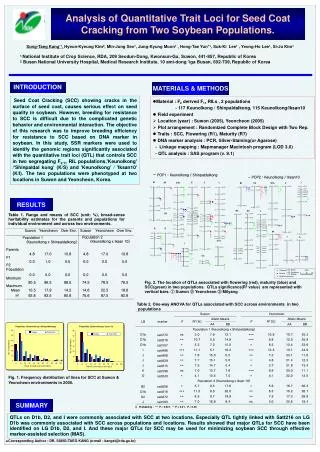
21. The ANOVA method is used to detect marker differences when there are more than two marker genotypes. It essentially produces a ranking of genotypes, in order of phenotypic effect for the trait of interest, and tests for significant differences between each genotype.
23. The multiple regression method is a simple remodelling of the ANOVA technique in regression terms, with the same ranking and testing for differences.
25. The linear regression method is the most complex point analysis method, allowing different characteristics of the QTL to be investigated. Including: Additive effects
27. Flanking marker methods have been the most popular analysis techniques over recent years, because of their accuracy and level of characterisation of the putative QTL. There are two basic techniques in the flanking marker frame work: Maximum likelihood
30. In each method of estimation, a likelihood profile of the region between two flanking markers is produced. The log of each likelihood is then mapped against chromosome position to produce a likelihood map, like the one below:
31. The maximum likelihood estimate of map position is the highest point on the map. Whole chromosomes can be mapped by analysis of different regions, the maps can be joined producing a likelihood profile of the entire chromosome.
33. The regression method uses significantly less computational power to estimate maximum likelihood parameters.
35. There are four different techniques, within the multipoint mapping framework: Marker regression
37. The idea behind marker regressions is to utilize the linear relationship between the apparent affects of a marker on a quantitative character, and the substantial effects of all related QTLs that are linked to that marker.
39. Composite interval mapping uses multiple markers as additional factors in the analysis, and is an expansion of the basic interval mapping technique. Five different types of markers are considered, depending on the characteristics of the chromosome region: Markers surrounding the QTL of interest
41. The standard marker trait regression approach uses properties of the regression of phenotype on marker genotype. The regression coefficients change depending on whether a QTL is present in the flanking region or not: If a QTL is present, the regression coefficients are significantly different to zero
43. Multiple interval mapping uses multiple marker intervals simultaneously and aims to map multiple QTL in a single step. It is possible to detect: Epistatic QTL
45. QTLs have been detected in many species, for example: Arabidopsis
46. Circadian rhythm � four QTL were detected
through maximum likelihood
47. Fruit ripening time � two QTLs were detected
through regression analysis
48. Seed dormancy � four QTLs were detected
by ANOVA analysis
49. Tolerance to salinity � four QTL were mapped
controlling different aspects
50. A comprehensive set of references links and further information is available on the associated web site. http://nasc.nott.ac.uk/students/qtl/frames.html