Download
1 / 1
10 likes | 136 Views
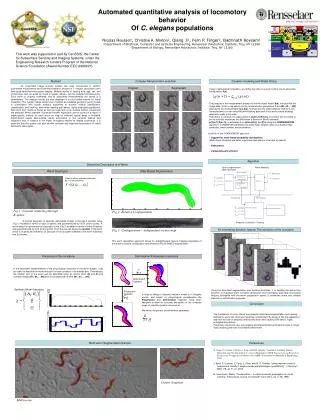
L. D1b. C2. D1b. J. F. satt495. 0.0. satt160. satt460. 0.0. satt596. satt216. 0.0. 0.0. 0.0. satt216. 0.0. 1. 1. 2. 9.4. satt529. satt100. 8.0. 3. 2. 12.3. satt406. 3. 1. satt238. 18.9. 3. 16.1. satt414. 1. 1. satt157. 19.8. satt380. 21.4. 1. satt398.

E N D
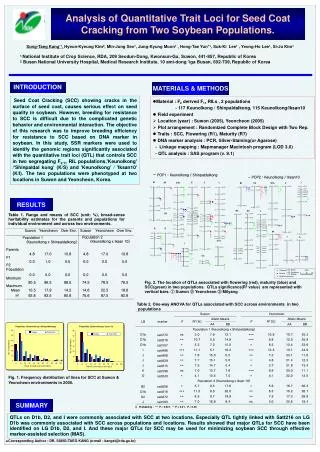
L D1b C2 D1b J F satt495 0.0 satt160 satt460 0.0 satt596 satt216 0.0 0.0 0.0 satt216 0.0 1 1 2 9.4 satt529 satt100 8.0 3 2 12.3 satt406 3 1 satt238 18.9 3 16.1 satt414 1 1 satt157 19.8 satt380 21.4 1 satt398 33.7 satt183 27.5 satt278 45.7 satt266 40.6 sct_001 41.0 2 2 2 1 satt296 45.5 satt418 61.7 satt371 45.9 2 satt114 57.7 satt537 D2 59.8 B2 L 3 1 satt266 61.4 M 77.7 satt313 B1 satt458 0.0 satt495 satt577 0.0 0.0 satt189 73.9 satt335 74.0 satt590 3 0.0 2 satt431 3 75.6 3 satt506 79.4 satt014 1 1 2 9.6 2 1 1 2 97.6 sct010 3 2 satt141 83.9 3 satt238 17.3 1 2 1 satt567 13.4 satt350 2 90.7 24.4 satt523 satt372 22.0 satt166 109.0 satt537 91.3 satt197 30.0 25.4 satt278 28.0 satt418 satt229 120.8 satt546 104.4 2 3 30.5 satt398 satt245 37.1 satt154 30.3 33.3 satt126 105.2 satt546 3 1 2 K 2 40.2 satt462 115.4 satt172 D1a satt513 136.9 114.9 satt554 satt373 satt175 139.8 43.4 52.1 satt497 satt137 0.0 O satt274 129.3 satt547 54.6 satt313 I 125.6 satt417 10.2 satt459 satt397 137.6 65.6 satt173 0.0 satt571 0.0 satt167 14.0 satt389 78.7 satt184 0.0 82.8 sct_010 86.4 satt076 satt556 81.5 satt226 89.8 91.9 satt527 86.5 satt020 satt260 41.8 1 satt336 90.7 92.9 satt166 satt066 92.8 Flowering satt196 105.5 satt063 60.8 satt571 0.0 satt243 50.0 satt229 115.0 satt292 50.0 2 Maturity sat_022 123.9 2 3 1 satt580 50.0 satt108 60.7 satt496 20.0 133.5 satt373 satt292 52.1 95.5 satt147 satt148 81.8 - POP1 : Keunolkong / Shinpaldalkong - POP2 : Keunolkong / Iksan10 satt440 111.5 A1 A2 E J B1 satt197 satt276 satt596 satt411 0.0 0.0 0.0 satt177 0.0 0.0 1 3 1 2 2 20.1 satt212 2 satt050 28.5 1 1 satt287 38.8 2 3 satt285 44.6 satt453 satt385 41.5 48.9 57.4 satt151 satt187 54.3 satt545 61.3 satt045 74.1 satt263 sct065 78.5 satt204 76.8 3 1 satt132 81.1 2 satt268 79.1 satt529 86.7 satt117 84.0 1 satt236 86.0 satt406 91.4 satt483 89.8 2 satt185 102.0 satt183 109.5 O 121.3 satt215 satt173 0.0 3 133.3 satt231 2 I 30.0 satt592 2 satt547 171.3 satt553 174.7 satt243 54.3 2 3 C2 1 1 3 2 satt100 0.0 satt460 4.7 R2(%) 1 ’05, Suwon 25 2 50 ’05, Yeoncheon 0 ’01, Milyang 3 Seed Coat Cracking Analysis of Quantitative Trait Loci for Seed Coat Cracking from Two Soybean Populations. Sung-Taeg Kang*1, Hyeun-Kyeung Kim2, Min-Jung Seo1, Jung-Kyung Moon1 , Hong-Tae Yun*1, Suk-Ki Lee1 , Yeong-Ho Lee1, Si-Ju Kim1 1 National Institute of Crop Science, RDA, 209 Seodun-Dong, Kwonsun-Gu, Suwon, 441-857, Republic of Korea 2 Busan National University Hospital, Medical Research Institute, 10 ami-dong 1ga Busan, 602-739,Republic of Korea MATERIALS & METHODS INTRODUCTION Seed Coat Cracking (SCC) showing cracks in the surface of seed coat, causes serious effect on seed quality in soybean. However, breeding for resistance to SCC is difficult due to the complicated genetic behavior and environmental interaction. The objective of this research was to improve breeding efficiency for resistance to SCC based on DNA marker in soybean. In this study, SSR markers were used to identify the genomic regions significantly associated with the quantitative trait loci (QTL) that controls SCC in two segregating F2:11 RIL populations,'Keunolkong' /'Shinpaldal kong’ (K/S) and 'Keunolkong' / 'Iksan10' (K/I). The two populations were phenotyped at two locations in Suwon and Yeoncheon, Korea. • Material : F2 derived F11 RILs , 2 populations - 117 Keunolkong / Shinpaldalkong, 115 Keunolkong/Iksan10 • Field experiment • Location (year) : Suwon (2005), Yeoncheon (2005) • Plot arrangement : Randomized Complete Block Design with Two Rep. • Traits : SCC, Flowering (R1), Maturity (R7) • DNA marker analysis : PCR, Silver-Staining(or Agarose) - Linkage mapping : Mapmanager Macintosh program (LOD 3.0) - QTL analysis : SAS program (v. 9.1) RESULTS Table 1. Range and means of SCC (unit: %), broad-sense heritability estimates for the parents and populations for individual environment and across two environments. Fig. 2. The location of QTLs associated with flowering (red), maturity (blue) and SCC(green) in two populations. QTLs significance(R2 value) are represented with vertical bars. ① Suwon ② Yeoncheon ③ Milyang Table 2. One-way ANOVA for QTLs associated with SCC across environments in two populations Population 1(Keunolkong x Shinpaldalkong) Population 2(Keunolkong x Iksan 10) Fig. 1. Frequency distribution of lines for SCC at Suwon & Yeoncheon environments in 2005. SUMMARY § Probability : *** P < 0.001, ** P < 0.01, P < 0.05 QTLs on D1b, D2, and I were commonly associated with SCC at two locations. Especially QTL tightly linked with Satt216 on LG D1b was commonly associated with SCC across populations and locations. Results showed that major QTLs for SCC have been identified on LG D1b, D2, and I. And these major QTLs for SCC may be used for minimizing soybean SCC through effective marker-assisted selection (MAS). • Corresponding Author : DR. SUNG-TAEG KANG (e-mail : kangst@rda.go.kr)