Download
1 / 28
280 likes | 408 Views
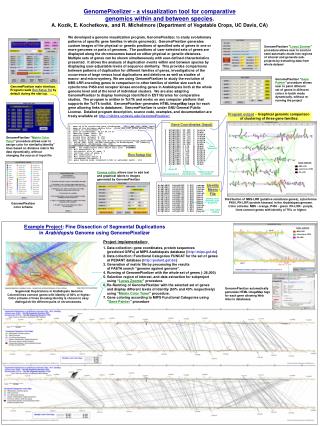
This project presents the development of the Visual ARIES Systems Scanning Tool (VASST) aimed at enhancing the ARIES Systems Code. VASST provides a comprehensive visualization tool to explore a wide parameter space, aiding in the identification of critical design insights. By leveraging the parallel processing capabilities of powerful computing clusters, users can effectively visualize large datasets, unlocking new relationships and improving design robustness. The GUI offers interactive 2D and 3D plotting, supporting various common parameters and facilitating real-time parameter interactions to enhance user experience.

E N D
Development of a Visualization Tool for the ARIES Systems Code Lane Carlson ARIES-Pathways Project Meeting UCSD May 19, 2010
Systems code has evolved into a design space scanning tool • Rather than optimize about a specific design point, new approach scans a wide operating space for a range of possible design points. • It becomes necessary to visualize slopes - is it a steep optimization point with no leeway or at a shallow point with a relaxed constraint? • A larger design window may open when a constraint is slightly relaxed, with substantial improvement in COE. • Other times, moving away from the “optimized” point gives a more robust and credible design with minimal impact on COE. (From F. Najmabadi)
Large databases can be processed • Have capability to parallel process the databases on a cluster with hundreds of nodes. • Princeton Plasma Physics (PPPL) • computer cluster: • 200+ processors • Quad-core CPUs • Up to 16 GB RAM • 1 gigabit ethernet 10^6 = 60 days with laptop vs. 1 day with 20 nodes PPPL Cluster
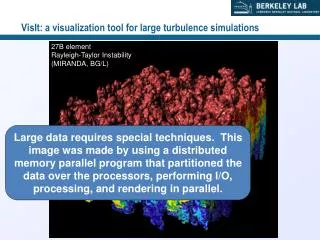
It is a challenge to visualize large data sets • Visualizing large datasets is a difficult task, almost an art • 106 points overwhelm monitor real estate • “Lots of numbers don’t make sense to ‘low-bandwidth’ humans, but visualization can encode large amounts of data to gain insight.”- San Diego Super Computer Center SDSCC Earthquake Simulation NOAA (National Oceanic and Atmospheric Admin.) data-logging buoys
More examples of visualizing large data sets European Airspace Reboot: During volcano activity (April 17, 2010) World Data from Gapminder.org Income per person vs. life expectancy European Airspace Reboot: After volcano activity (April 20, 2010)
We are developing a visualization tool to utilize the scanning capability of the new systems code • VASST - Visual ARIES Systems Scanning Tool • Working to visualize the broad parameter space to extract meaningful data and uncover new relationships • Graphical user interface (GUI) permits 2D and 3D plots of any parameter Purpose: to give the user more visual interaction and explorative power to bring to light new relationships
(Visual ARIES Systems Scanning Tool) Number of points in database VASST GUI Highlights Blanket database used Auto-labeling Pull-down menus for common parameters Color bar scale Constraint parameter set by user Data cursor displays info on mouse-click Correlation coefficient Save plot as TIFF, JPEG, BMP, PNG…
Example: Qdivinb vs COE, CC: B, constraint: B=8.5 T SiC blanket
Example: Qdivinb vs COE, CC: B, constraint: B=7.5 T SiC blanket
Example: Qdivinb vs COE, CC: B, constraint: B=7.0 T SiC blanket
Example: Qdivinb vs COE, CC: B, constraint: B=6.5 T SiC blanket
Example: Qdivinb vs COE, CC: B, constraint: B=6.0 T SiC blanket
Example: Qdivinb vs COE, CC: B, constraint: B=5.0 T SiC blanket
Extra: Pnelec (unrestricted) vs COE, CC: COE SiC blanket Possible attractive power plant designs in the 500 MW range
Extra: B vs COE, CC: R SiC blanket
Extra: Btmax vs COE, CC: R SiC blanket
An additional visualization feature might include “linking and brushing” the data Highlighting any parameter space would show real-time effect on other parameters
Three important elements are required to operate VASST A intuitive visualization tool A capable, experienced user In-depth chronicle of details
A chronicle/history is required for record keeping purposes • What input parameters were used? • What version of the systems code was used? (Subversion control) • What blanket was implemented? • What were the assumptions applied in the code? • What filters were implemented? (Pnetel, Qdiv, B, etc.) • What costing algorithms were used? • Every result/picture/graph should be backed up with specifics of its origin
Revision control is necessary and helpful • Needful to control revisions to the code to keep track of changes made by multiple users. • Subversion (SVN) revision control software keeps the code centralized in a server repository. • Users can “check out” the code, modify it, then “commit” it back to the central server as the most recent updated version.
Clarification of assumptions • Btmax vs. SC current = ? • Three references are an order of magnitude apart.
Clarification of assumptions From Jan 2009 ARIES meeting, Z.D. • Need clarification of specifics between DCLL and SiC blanket. • Any other assumptions that need concrete definitions? Basis for physics and engineering design? • Scaling factors from other designs? From paper, “An advanced computational…” by Z.D.
We would like to fill in the operating space • Are there pertinent or interesting areas the ARIES team would like to look at? • - Increase Qdiv? Elongate plasma? More aggressive or relaxed B? • Comments, suggestions, improvements? ARIES-AT physics DCLL blanket ARIES-AT physics SiC blanket Aggressive in physics ARIES-I physics DCLL blanket ARIES-I physics SiC blanket Aggressive in technology
Summary • The systems code is operational and able to scan and process a large design space. • A first version of VASST GUI is operational and ready to look at pertinent system scans for the ARIES team. • Beginning chronicle of details and specifics of the different blanket modules. Live VASST demo?
Future work • Re-examine the TF and PF coil j vs. B relationships. • Prior SC magnets may be too optimistic (3x) - re-examine lower B fields for possible solutions. • Develop solutions to the power balancing within the limits of materials/coolants - critical to accessing smaller power plants. • After a broad scan, fill in the operating space of the four corners with sufficient resolution.
Extra Slides • To discuss individually: • Rev number for costing algorithms? 2 blanket types: SiC and DCLL (C.K.) DCLL ΔFW = 0.038 m Δblkt = 0.50 m ΔVV = 0.31 m Δshld/skel = 0.35+0.075xIn(<Nw>/3.3) m ηth ~ 42%, Ppump ~ 0.04xPfusion SiC ΔFW = 0.0 m Δblkt = 0.35 m ΔVV = 0.40 m Δshld/skel = 0.24+0.067xIn(<Nw>/3.3) m ηth ~ 55%, Ppump ~ 0.005xPfusion
ARIES systems code consists of modular building blocks • Systems code integrates physics, engineering, design, and costing. Systems Code Analysis Flow 1. PHYSICS Plasmas that satisfy power and particle balance 2. ENGINEERING FILTERS APPLIED 3. ENGINEERING & COSTING DETAILS Power core, power flow, magnets, costing, COE Filters include: Modules include: Toroidal magnetic fields Heat flux to divertor Neutron wall load Net electric power Blankets Geometry Magnets Power flow Costing DCLL SiC ARIES-AT