Download
1 / 17
170 likes | 351 Views
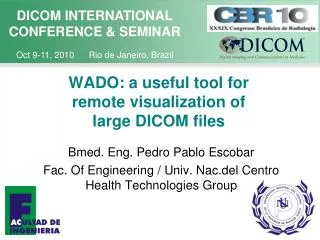
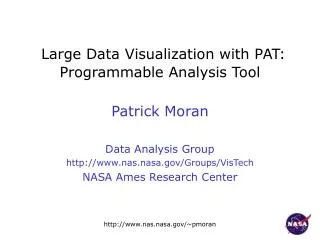
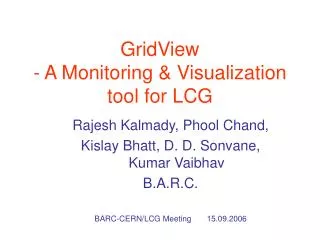
VisIt: a visualization tool for large turbulence simulations. 27B element Rayleigh-Taylor Instability (MIRANDA, BG/L).

E N D
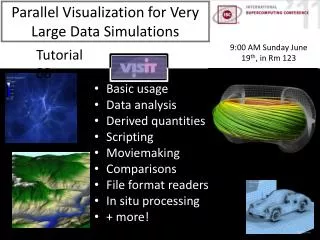
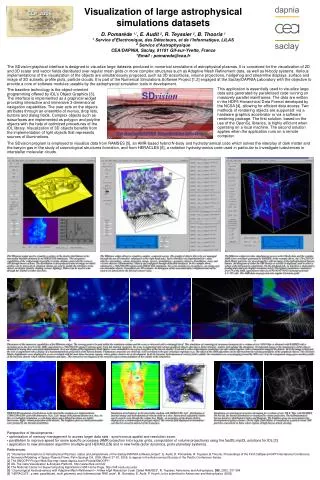
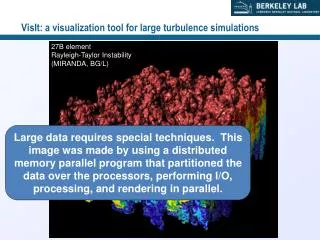
VisIt: a visualization tool for large turbulence simulations 27B element Rayleigh-Taylor Instability (MIRANDA, BG/L) Large data requires special techniques. This image was made by using a distributed memory parallel program that partitioned the data over the processors, performing I/O, processing, and rendering in parallel.
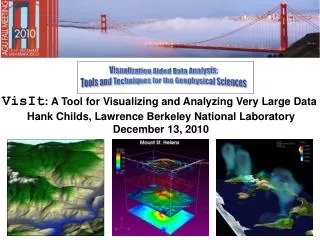
Visualizing and Analyzing Large-Scale Turbulent Flow • Detect, track, classify, and visualize features in large-scale turbulent flow. VisIt calculated connected components on a 4K^3 turbulence data in parallel using TACC's Longhorn machine. 2 million components were initially identified and then the map expression was used to select only the components that had total volume greater than 15. Data courtesy of P.K. Yeung & and Diego Donzis
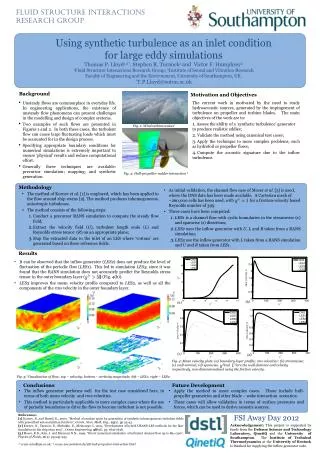
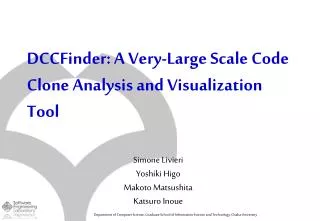
Flow analysis for 217 pin simulation / 1 billion grid points 217 pin reactor cooling simulation. Run on ¼ of Argonne BG/P.
Flow analysis for 217 pin simulation / 1 billion grid points
Observe which channels the particles come out Tracing particles through the channels Place 1000 particles in one channel
This analysis depended on improvements in parallel particle advection P2 P4 P1 P0 P3 P2 P1 P3 P4 P0 P0 P4 P1 P3 P2 P0 P1 P3 P4 P2 P1 P3 P0 P4 P2 • Two extremes: • Partition data over processors and pass particles amongst processors • Parallel inefficiency! • Partition seed points over processors and process necessary data for advection • Redundant I/O! P0 P1 P3 P2 P4 Notional streamline example
This analysis depended on improvements in parallel particle advection • Hybrid solution: • Master-slave approach that adapts between parallel inefficiencies and redundant I/O P0 P0 0: Read • Decision of when to pass or read is simplified here and based on load of processors owning data. • Heuristic weights against I/O, but allows for redundant I/O • - All coordination done by slave masters. P1 1: Pass 0: Read P2 P1 P3 P2 1: Read P4 1: Pass Notional streamline example
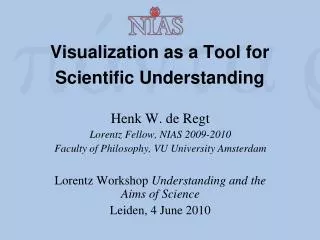
VisIt is a richly featured, turnkey application 1 billion grid points • VisIt is an open source, end user visualization and analysis tool for simulated and experimental data • Used by: physicists, engineers, code developers, vis experts • >100K downloads on web • R&D 100 award in 2005 • Used “heavily to exclusively” on 8 of world’s top 12 supercomputers 217 pin reactor cooling simulation. Run on ¼ of Argonne BG/P. 4 9
Terribly Named!! Intended for more than just visualization! Visual Debugging ? = Quantitative Analysis Data Exploration Comparative Analysis Presentations 10
VisIt has a rich feature set that can impact many science areas. • Meshes: rectilinear, curvilinear, unstructured, point, AMR • Data: scalar, vector, tensor, material, species • Dimension: 1D, 2D, 3D, time varying • Rendering (~15): pseudocolor, volume rendering, hedgehogs, glyphs, mesh lines, etc… • Data manipulation (~40): slicing, contouring, clipping, thresholding, restrict to box, reflect, project, revolve, … • File formats (~85) • Derived quantities: >100 interoperable building blocks +,-,*,/, gradient, mesh quality, if-then-else, and, or, not • Many general features: position lights, make movie, etc • Queries (~50): ways to pull out quantitative information, debugging, comparative analysis 11
localhost – Linux, Windows, Mac VisIt employs a parallelized client-server architecture. Graphics Hardware remote machine • Client-server observations: • Good for remote visualization • Leverages available resources • Scales well • No need to move data User data Parallel vis resources • Additional design considerations: • Plugins • Multiple UIs: GUI (Qt), CLI (Python), more… 12
The VisIt team focuses on making a robust, usable product for end users. • Manuals • 300 page user manual • 200 page command line interface manual • “Getting your data into VisIt” manual • Wiki for users (and developers) • Revision control, nightly regression testing, etc • Executables for all major platforms • Day long class, complete with exercises Slides from the VisIt class 13
More developers Entering repo all the time SciDAC Outreach Center enables Public SW repo 2005 R&D100 Developers from LLNL, LBL, & ORNL Start dev in repo LLNL user community transitioned to VisIt GNEP funds LLNL to support GNEP codes at Argonne UC Davis & UUtah research done in VisIt repo AWE enters repo Project started Partnership with CEA is developed Institutional support leverages effort from many labs VACET is funded Saudi Aramco funds LLNL to support VisIt VisIt is a vibrant project with many participants. User community grows, including AWE & ASC Alliance schools 2003 2007 2007 2004-6 ‘07-’08 ‘07-’08 2000 2005 Summer‘07 Spring ‘08 Spring ‘07 • Over 50 person-years of effort • Over one million lines of code • Partnership between: Department of Energy’s Office of Nuclear Energy, Office of Science, and National Nuclear Security Agency, and among others Fall ‘06 2008 Spring ‘09 14
VisIt was recently demonstrated to show good performance at unprecedented scales. 16K #cores Problem Size Model Machine 8K 0.5T IBM P5 Purple 16K 1T Sun Ranger 1T X86_64 Juno 32K 2T Cray XT5 JaguarPF 64K 4T BG/P Dawn 16K, 32K 1T, 2T Cray XT4 Franklin • Weak scaling study: ~62.5M cells/core 15
Three Ways To Get Data Into VisIt • (1) Write to a known output format • (2) Write a plugin file format reader • (3) Integrate VisIt “in situ” • “lib-VisIt” is linked into simulation code • (Note: Memory footprint issues with implementation!) • Use model: • simulation code advances • at some time interval (e.g. end of cycle), hands control to lib-VisIt. • lib-VisIt performs vis & analysis tasks, then hands control back to simulation code • repeat 16
VisIt: What’s the Big Deal? • What’s the big deal? • Everything works at scale • Robust, usable tool • Vis to code development to scientific insight • Learn more: • Google: “visit visualization” • http://www.llnl.gov/visit / http://www.visitusers.org • visitusers@ornl.gov • Live & online tutorials • Publicly available SVN • Hank Childs, • hchilds@lbl.gov 17