Download
1 / 16
170 likes | 304 Views
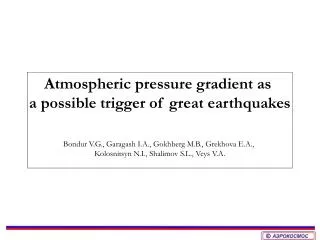
Atmospheric pressure gradient as a possible trigger of great earthquakes Bondur V.G., Garagash I.A., Gokhberg M.B., Grekhova E.A., Kolosnitsyn N.I., Shalimov S.L., Veys V.A. Possible Trigger Mechanisms. Seismic wave action M. West, J.J. Sanchez, S.R. McNutt. Science, vol. 308, 1144 (2005)

E N D
Atmospheric pressure gradient as a possible trigger of great earthquakes Bondur V.G., Garagash I.A., Gokhberg M.B., Grekhova E.A., Kolosnitsyn N.I., Shalimov S.L., Veys V.A.
Possible Trigger Mechanisms Seismic wave action M. West, J.J. Sanchez, S.R. McNutt. Science, vol. 308, 1144 (2005) Electromagnetic action – MGD pulses and Geomagnetic storms 1) E.P. Velikhov, Theory and method of deep electromagnetic sounding of crystalline shields. Apatity, 2006 2) N.T. Tarasov et al. USSR Doklady, vol. 353, 545 (1997); Volcanology and Seismology, 4-5, 153(1999); 3) G.A. Sobolev et.al. Volcanology and Seismology, 3, 63 (2004) Atmosphere pressure gradient (APG) A.D. Sytinsky, USSR Doklady, vol. 245, 1337 (1979); V.G. Bondur, I.A. Garagash, M.B. Gokhberg et al. Doklady Ac.Si., vol. 430, 400-404 (2007)
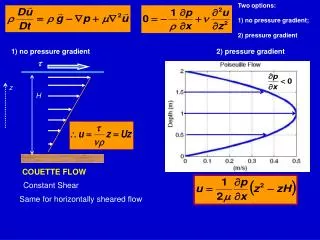
Rayleigh wave reconstruction: shear stress on depth 2 km – σxz = 1.95 kPa; amplitude uz = 0.75 cm; velocity U = 3.7 km·s-1; period T = 30 s; wave length λ = UT = 111km; decay depth for longitudinal (Ll) and transverse (Lt) components: Ll = 21 km, Lt =45 km G = 3.5·1010 Pa When σxz achieves maximum the values σxz, σxz, uz = 0 and local earthquakes are occured Energy density F = (1/4)( σxz)2/G Full energy E = F·V Sadovsky formula: lg EL =lgV + 2 EL = 4.47·1014 erg (M = 1.9) V = 4.5·105 m3 E = 1.3·108 erg Energy relation E/EL ~ 10-6 Seismic records of the Sumatra earthquake and local events at Mount Wrangell
Electromagnetic Trigger Mechanisms Central Asian (70-80): N. Tarasov et al. Earth crust investigation by means of electric dipole with energy impulse Eem ≈ 1014 erg. As a result seismic activity was recorded with seismic energy Esm ≈ 1019 erg so that the energy ratio is Eem/ Esm ~ 10-5 G.A. Sobolev et al. showed that due to trigger mechanism of geomagnetic storms with sudden commencement the appearance of earthquakes with M > 2 in some events may be explained (G.A. Sobolev et al. Volcanology and Seismology 2001, № 11, 62-72; 2004, № 3, 63-75; Fizika Zemli 2002, № 4,3-15). Following E.R. Mustel et al. (Astron. J., vol. 42, 1232 (1965)) geomagnetic storm time variations can globally excite multiple regions with atmospheric pressure gradients. This results in increase of a chance to get by atmospheric gradient of a region with preparing EQs
Trigger Mechanism by APG • The estimation of the trigger effect from APG is making on example of the biggest earthquake Sumatra M = 9.1 • Due to “inverse barometer” effect the deformations are confined only by Sumatra area S= 1000×200 km2. • At pressure difference p = 1.33·103 Pa (10 mm Hg), the shear • modulus – μ, Lame’s parameter – λ: μ = λ = 35·109 Pa and Poisson ratio σ = 0,25, using Boussinesq solution for deformation energy it has obtained the estimate • E ~ 3·1019 erg • Magnitude M = 9 correspond to energy EL of 2·1025 erg • As a result • E/EL ~ 10-6
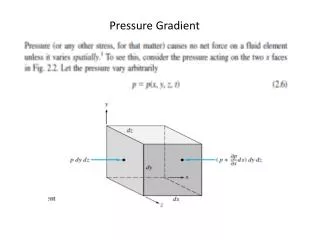
The pressure p created by atmospheric anomalies get in deeply and unlike seismic perturbations operate long enough within several days1. Distribution of main shear stress t arising in elastic earth crust under the influence of atmospheric anomaly is shown. Distribution of the relation of horizontal deformationex/eto characteristic deformatione=p/2G Distribution of the relation of vertical deformationey/eto characteristic deformatione=p/2G Distribution of dimensionless main shear stress t/p 1Garagash I.A., Ingel L.Kh. and Yaroshevich M.I. (2004) A Possible Mechanism of Atmospheric Effects onSeismicActivity near Ocean Coasts, Izvestiya, Phys. Solid Earth 40, p.692–698
R is parameter of closeness of stress state to strength limit The parameter R entered by us allows to watch for dynamics of stress state is the friction angle are the main stresses are the shear stress intensity and shear strain intensity, respectively is the maximum strength value is the residualstrength
3D Calculation of the stress-strain state on the Californian testing area “China Lake” with evidence of short-term earthquake prediction Fault zones close to Coulomb-Mohr shear zone yields proper condition due to decreasing of atmospheric pressure by 2.5% range z -3200m -4800m range z -4800m -6400m Gokhberg M.B.,Garagash I.A.,Nechaev Yu.V.,Rogozhin E.A., Yunga S.L. Geomechanical model of seismic claster China Lake, South CaliforniaResearches in the geophysics. IPE RAS, 2004
Examples of the APG before EQ with M >7.5 in the epicenter vicinity Days (relative to an earthquake moment) Only negative APG before EQ can produce trigger effect
Atmospheric pressure Days (relative to an earthquake moment)
APG statistical distribution relatively time before earthquakes 2000 – 2010 years. The number of events N ~ 50
Modeling of APG trigger for Sumatra M9.1 While seismic and electromagnetic impulses last seconds, and the sources of large earthquakes has the inertial action, the APG continue during the days and its scale is comparable with the scale of large earthquakes If parameter R < 0 the earth crust keeps away from a limiting state, at R> 0 – it comes nearer. In calculations the transfer of pressure upon the earth crust is carried out only on areas which have been not covered with ocean. The maximum value of pressure excess is no more than 1% from the average atmospheric pressure. It is evident that in the anomalous zone the top layer 1 keeps away from the strength limit whereas the deeper layers 2, 3 and 4 – comes nearer. Thus, abnormal pressure approaches these zones to strength limit and hence can cause trigger effect. Distribution of parameter R in the layer 1 1.The four-layer model has been designed for Sumatra 2. 3D distribution of the elastic energy density was calculated 3. Dynamic of parameter R induced by APG is presented Distribution of parameter R in the layer 4 Bondur V.G., Garagash I.A., Gokhberg M.B., Lapshin V.M., Nechaev Yu.V., Steblov G.M., Shalimov S.L., (2007) Geomechanical models and ionospheric variations related to strongest earthquakes and weak influence of atmospheric pressure gradients. Doklady Earth Sciences, Vol. 414, No. 4, pp. 666–669
Conclusion For all trigger mechanism the ratio between input and output energies is estimated to be 10-5 – 10-6 Large scale atmospheric pressure gradient (APG) can create the additional deformation deep enough in the earth’s crust The ocean – land boundary can effectively transform homogeneous atmospheric pressure into its sharp gradient acting on the earth’s crust APG is large scale process that can be considered as the trigger mechanism for strongest earthquakes
For discussion APG trigger conception can kill the representation of the existence different precursor’s effects APG and magnetic storms exist permanently. These phenomena with very well known physics produce a lot of different anomaly in the Earth-Atmosphere-Ionosphere-Magnetosphere systems which can be mistakenly considered as the precursor effects.
Monitoring of strain and strength of earth crust on the basis of close to real geomechanical models for the purpose of the seismicity forecast on the interval week – month. Model of earth crust of Southern California: a) general view, b) normalized distribution of the damage in the upper crust and c) map GPS velocities Normalized distribution of parameter R of nearness of stress state to strength limit for 15.12.2009 in the layer 1 (upper crust) and in the layer 4 (middle crust) Changes of summary magnitudes (the dark blue graph) and strength parameter R in the upper crust (the red graph)
Distribution of the relation of horizontal deformationex/eto characteristic deformatione=p/2G Distribution of the relation of vertical deformationey/eto characteristic deformatione=p/2G