CUAHSI Observations Data Model
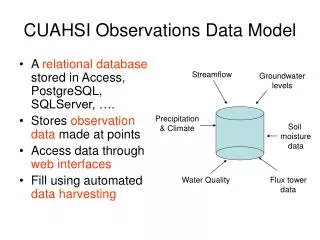
A relational database stored in Access, PostgreSQL, SQLServer, …. Stores observation data made at points Access data through web interfaces Fill using automated data harvesting. CUAHSI Observations Data Model. Streamflow. Groundwater levels. Precipitation & Climate. Soil moisture

CUAHSI Observations Data Model
E N D
Presentation Transcript
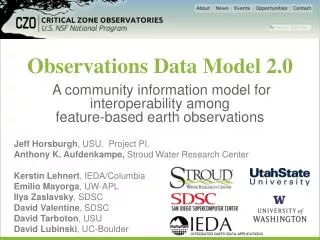
A relational database stored in Access, PostgreSQL, SQLServer, …. Stores observation data made at points Access data through web interfaces Fill using automated data harvesting CUAHSI Observations Data Model Streamflow Groundwater levels Precipitation & Climate Soil moisture data Water Quality Flux tower data
Purposes • Hydrologic Observations Data System to Enhance • Retrieval • Integrated Analysis • Multiple Investigators • Standard and Scalable Format for Sharing • Ancillary information (metadata) to allow unambiguous interpretation and use – incorporating uncertainty • Traceable heritage from raw measurements to usable information – quality control levels Premise • A relational database at the single observation level (atomic model) • Querying capability • Cross dimension retrieval and analysis
Community Design Requirements(from comments of 22 reviewers) • Incorporate sufficient metadata to identify provenance and give exact definition of data for unambiguous interpretation • Spatial location of measurements • Scale of measurements (support, spacing, extent) • Depth/Offset Information • Censored data • Classification of data type to guide appropriate interpretation • Continuous • Indication of gaps • Indicate data quality
Scale issues in the interpretation of data The scale triplet a) Extent b) Spacing c) Support From: Blöschl, G., (1996), Scale and Scaling in Hydrology, Habilitationsschrift, Weiner Mitteilungen Wasser Abwasser Gewasser, Wien, 346 p.
From: Blöschl, G., (1996), Scale and Scaling in Hydrology, Habilitationsschrift, Weiner Mitteilungen Wasser Abwasser Gewasser, Wien, 346 p.
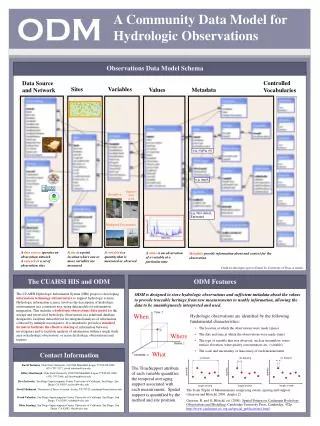
Hydrologic Observations Data Model What are the basic attributes to be associated with each single observation and how can these best be organized? Data Source and Network Controlled Vocabulary Tables Sites Variables Values Metadata e.g. mg/kg, cfs e.g. depth Streamflow Depth of snow pack Landuse, Vegetation e.g. Non-detect,Estimated, Windspeed, Precipitation A data source operates an observation network A network is a set of observation sites A site is a point location where one or more variables are measured A variable is a property describing the flow or quality of water A value is an observation of a variable at a particular time Metadata provide information about the context of the observation. Data Delivery Data Discovery See http://www.cuahsi.org/his/documentation.html Ernest To Center for Research in Water Resources University of Texas at Austin 20061011
Feature Hydrologic Observations Data Model Waterbody Watershed HydroPoint HydroID HydroID HydroID HydroCode HydroCode HydroCode * FType DrainID FType Name AreaSqKm Name AreaSqKm JunctionID JunctionID JunctionID NextDownID * * ComplexEdgeFeature SimpleJunctionFeature CouplingTable SiteID (GUID) HydroID (Integer) HydroEdge HydroJunction HydroJunction HydroJunction 1 HydroID 1 HydroID HydroID HydroID HydroCode HydroCode HydroCode HydroCode ReachCode NextDownID NextDownID NextDownID Name LengthDown LengthDown LengthDown LengthKm HydroNetwork DrainArea DrainArea DrainArea LengthDown FType FType FType FlowDir Enabled Enabled Enabled FType AncillaryRole AncillaryRole AncillaryRole EdgeType Enabled EdgeType Flowline Shoreline Independent of, but coupled to Geographic Representation Arc Hydro HODM 1 MonitoringPoint 1 SiteID SiteCode SiteName OR Latitude Longitude … 1 1
Variable attributes Cubic meters per second L3/T m3/s VariableName, e.g. discharge VariableCode, e.g. 0060 SampleMedium, e.g. water Valuetype, e.g. field observation, laboratory sample IsRegular, e.g. Yes for regular or No for intermittent TimeSupport (averaging interval for observation) DataType, e.g. Continuous, Instantaneous, Categorical GeneralCategory, e.g. Climate, Water Quality NoDataValue, e.g. -9999
Data Types • Continuous (Frequent sampling - fine spacing) • Instantaneous (Spot sampling - coarse spacing) • Cumulative • Incremental • Average • Maximum • Minimum • Constant over Interval • Categorical
Daily Average Discharge ExampleDaily Average Discharge Derived from 15 Minute Discharge Data
Offset OffsetValue Distance from a datum or control point at which an observation was made OffsetType defines the type of offset, e.g. distance below water level, distance above ground surface, or distance from bank of river
ODM and HIS in an Observatory Settinge.g. http://www.bearriverinfo.org
Web Server ODM and HIS in an Observatory SettingIntegration of Sensor Data With HIS Data Processing Applications Internet Base Station Computer(s) Observations Database (ODM) Data discovery, visualization, analysis, and modeling through Internet enabled applications Telemetry Network Internet Programmer interaction through web services Workgroup HIS Tools Sensors
Web Server Available National and Workgroup HIS Tools Internet Observations Database (ODM) Data discovery, visualization, analysis, and modeling through Internet enabled applications Other National Databases NWIS, STORET, Etc. Programmer interaction through web services
Automated Ingestion of Sensor Data into ODM Data Processing Applications • Challenges • Heterogeneity • Establishing standards • Sensor/system descriptions Sensor ML Base Station Computer(s) Observations Database (ODM) Telemetry Network Internet Sensors
Data Distribution Via XML Web Services • Machine to machine communication of data over the internet • Users can program against database as if it were on their local machine • Replace SQL queries to database with calls to the appropriate web service
Example: Matlab use of CUAHSI Web Services % create ODM Web Service Class createClassFromWsdl('http://water.usu.edu/BRODM/brodm.asmx?WSDL'); % Discover the sites available xmlSites=GetSites(instODM); strSites=xml_parse(xmlSites); Nsites=length(strSites.Sites) … % Get information about a selected site xmlSiteInfo=GetSiteInfo(instODM,scode); strSiteInfo=xml_parse(xmlSiteInfo); … % Get the data values xmlValues = GetValues(instODM,scode,varcode,D1i,D2i); strValues=xml_parse(xmlValues); … % Plot the data plot(dt,vals); datetick % Axis label from metadata from web service return ylabel(strSiteInfo.Variables(var).Variable.VariableName)
ODM Next Steps • Beta test in test beds (unanticipated requirements) • Unit conversions • Additional data types (vector, grid) • Tools, incl. Data Loader • Integration with search • [Moving sensors (FerryMon)]
Managing Data Within ODM - ODM Tools • Load – import existing data directly to ODM • Query and export – export data series and metadata • Visualize – plot and summarize data series • Edit – delete, modify, adjust, interpolate, average, etc.