Simulation of Upper Tropospheric CO2 Using 2D and 3D Models by NASA Researchers
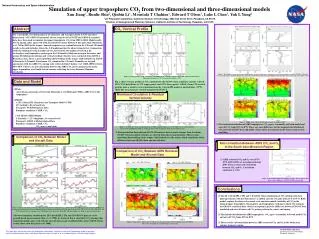
This study compares CO2 simulations in the upper troposphere using a two-dimensional chemistry and transport model (CTM) and a three-dimensional GEOS-Chem model, driven by NCEP and GEOS-4 reanalysis data from 2000 to 2004. Results indicate strong agreement with aircraft observations in tropical regions; however, discrepancies appear in mid-latitudes where the 2D model outperforms the 3D model. Notable findings include variations in meridional circulations and vertical residual velocities, impacting CO2 distribution and highlighting the need for further investigation into model discrepancies.

Simulation of Upper Tropospheric CO2 Using 2D and 3D Models by NASA Researchers
E N D
Presentation Transcript
(a) (b) (c) National Aeronautics and Space Administration Simulation of upper troposphere CO2 from two-dimensional and three-dimensional models Xun Jiang1, Runlie Shia2, Qinbin Li1, Moustafa T Chahine1, Edward T Olsen1, Luke L Chen1, Yuk L Yung2 1Jet Propulsion Laboratory, California Institute of Technology, 4800 Oak Grove Drive, Pasadena, CA 91109 2Division of Geological and Planetary Sciences, California Institute of Technology, Pasadena, CA 91125 Abstract CO2 Vertical Profile Jan Apr Solid: GEOS-Chem; Dash: 2D Caltech/JPL CTM The Caltech/JPL two-dimensional (2-D) chemistry and transport model (CTM) and three-dimensional (3-D) GEOS-Chem model, driven respectively by NCEP and GEOS-4 reanalysis data, have been used to simulate the upper tropospheric CO2 from 2000 to 2004. Model results of CO2 mixing ratios agree well with aircraft observations between 9 km and 13 km [Matsueda et al., Tellus 2002] in the tropics. Some discrepancies are evident between the 2-D and 3-D model results in the mid-latitudes, where the 2-D model matches the observations better. Comparison of the the simulated vertical profiles of CO2 between the two models reveals that the stratosphere and troposphere exchange in the 3-D model is likely too strong in the winter and spring. Meridional circulations and vertical residual velocities were calculated from GEOS-4 Reanalysis data. There is more upwelling (downwelling) in the tropics (mid-latitudes) in GEOS-4 than in the 2-D model. Zonal mean CO2 simulated by 2-D and 3-D models are in good agreements with the AIRS CO2 mixing ratio retrievals from Chahine et al. [GRL 2005] between 40ºS-40ºN.There is an anti-correlation between the AIRS CO2 and O3 mixing ratios in the upper troposphere over South Asia in summer, reflecting the Asian Summer Monsoon circulation. 35N Jul Oct 5N Figure 5: Tropospheric CO2 from AIRS (black line) against 2D model (Green line), 3D model forced by CMDL boundary condition (Red line), 3D model forced by CO2 sources and sinks (Orange line), Matsueda aircraft data (Purple dots), and CMDL aircraft data (Blue cross) in Jan, Apr, Jul, and Oct of 2003. Figure 2: Vertical profile of CO2 computed by the GEOS-Chem (solid line) and the Caltech-JPL 2-D model (dotted line). Upper panel: Latitude = 5N. Lower panel: Latitude = 35N. Data and Model Fig. 2 shows vertical profiles of CO2 simulated by the GEOS-Chem (solid line) and the Caltech-JPL CTM (dotted line) at 5N (upper panel) and 35N (lower panel). GEOS-Chem CO2 vertical profiles show a smaller vertical gradient than the Caltech/JPL model at mid-latitudes (35N), likely due to an excessive vertical transport in GEOS-4. • Data: Aircraft measurements of CO2 from Matsueda et al. [2002] and CMDL; AIRS CO2 in the troposphere • Model: • > 2-D Caltech/JPL Chemistry and Transport Model (CTM) • 10º (latitude); 40 vertical levels • Transport: NCEP Reanalysis Data • Boundary condition: CMDL CO2 • > 3-D GEOS-CHEM Model • 2º(latitude) × 2.5º (longitude), 30 vertical levels • Transport: GEOS–4 Meteorological Data • Boundary condition: CMDL CO2 • CO2 sources and sinks Meridional Circulation & Residual Vertical Velocity • The latitude distribution of AIRS tropospheric CO2 agrees reasonably well with model and aircraft CO2 from 40ºS to 40ºN. There are some difference for the longitude distribution of CO2 between GEOS-Chem and AIRS, which will be investigated in the future using inverse modeling. Figure 6: GEOS-Chem CO2 at 300 hPa in Jan, Apr, Jul, and Oct of 2003. Figure 3: (a) Difference of stream function between GEOS-4 and 2D. Units are m2/s. (b) Difference of vertical residual velocity between GEOS-4 and 2D. (c) Vertical profile of vertical residual velocity at 35ºN. Units are m/s. • Stream function derived from GEOS-4 Reanalysis data is much stronger than that from NCEP. Vertical residual velocities are derived from the stream functions. There is more upwelling (downwelling) in the tropics (mid-latitudes) in the winter, which contributes to the difference between GEOS-Chem and aircraft data. Comparison of CO2 Between Model and Aircraft Data Anti-correlation Between AIRS CO2 and O3 In the South Asia Monsoon Region Comparison of CO2 Between AIRS Retrieval, Model and Aircraft Data • AIRS retrieved CO2 and O3 over 26ºN-30ºN, 60ºE-120ºE are investigated in July 2003. There is clear anti-correlation between CO2 and O3. Correlation coefficient is -0.52. (a) (b) Figure 7: Normalized AIRS CO2 and O3 from Jul 1, 2003 to Jul, 25, 2003. Please refer to Qinbin et al. [2006, AGU] for more detail. Conclusions (c) (d) • The 2D Caltech/JPL CTM and 3-D GEOS-Chem simulations of CO2 mixing ratio show good agreements with the Matsueda et al. [2002] aircraft CO2 data from 35ºS to 35ºN. Both models capture the observed seasonal cycle and interannual variability of CO2 in the tropical upper troposphere. Stratosphere and troposphere exchange is likely too strong in the GEOS-4 reanalysis data, which can explain in part the difference between GEOS-Chem simulated and aircraft observed CO2 mixing ratio in the winter and spring. • The latitude distribution of AIRS tropospheric CO2 agrees reasonably well with model CO2 and aircraft CO2 from 40ºS to 40ºN. • There is clear anti-correlation between AIRS retrieved CO2 and O3 in the South Asia summer monsoon region. Figure 1: Aircraft observations between 9 km and 13 km (red dots) [Matsueda et al., 2002] and modeled CO2 mixing ratios from the GEOS-Chem model averaged at the layer between 9 km and 13 km (solid line) from 2000 to 2004. The panels are for 35S, 25S, 15S, 5S, 5N, 15N, 25N, and 35N, respectively. For comparison, the CO2 mixing ratios from the Caltech-JPL 2-D model [Shia et al. 2006] are shown by dotted lines. The lower boundary conditions for 2D Caltech/JPL CTM and 3D GEOS-Chem are set to ground-based measurements [Tans et al. 1998]. As shown in Fig. 1, simulated CO2 mixing ratios from both models agree well with the aircraft data except at mid-latitudes, where GEOS-Chem results show a low bias [Shiaet al. 2006]. Figure 4: Tropospheric AIRS retrieved CO2 in Jan, Apr, Jul, and Oct of 2003 [Chahine et al., 2005 GRL]. Please refer to Chahine et al. [2006 AGU] for more detail. Jet Propulsion Laboratory California Institute of Technology Pasadena, California This work was carried out at the Jet Propulsion Laboratory, California Institute of Technology under a contract with the National Aeronautics and Space Administration as well as at a number of other research organizations