Download
1 / 11
110 likes | 149 Views
Learn how to account for land and subsoil assets in the Australian balance sheet, including valuation methods, production adjustments, depletion effects, and data sources.

E N D
Agenda item 3 Accounting for Natural Resources: Land and subsoil assets in the ABS Andrew Cadogan-Cowper Australian Bureau of Statistics
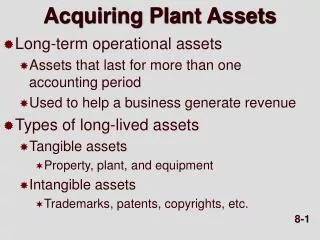
Overview • Environmental assets on the balance sheet • Land asset valuation and degradation • Subsoil asset valuation and depletion • Production adjusted for depletion and degradation
Non-Financial assets on the Australian balance sheet (chain volume measure, $ billion) Source: Australian System of National Accounts 2007-08 (ABS Cat. no. 5204.0)
Valuing residential land ABS Census of Population and Households Valuers-General Contractor (Australian Property Monitors) Elemental sales data RBA Mean sales data Dwelling count Residental land and dwelling stock ($) 92% to Household sector (published by RBA) 8% to Other sectors ABS Minus ABS estimate of household capital stock of dwellings Residental land + dwelling stock ($) for all sectors Scaled back up to 100% Minus ABS estimate of capital stock of dwellings for all sectors Total residential land ($) Minus Household Residential land Household residental land ($) Residual assigned to NFC and GG * * NFC and GG split using data from the Valuers-General and Public Finance
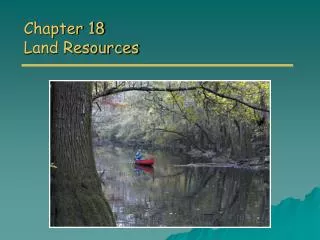
Measuring the volume of land • Balance sheets in the ASNA are compiled on the basis that land volumes do change over time • Volume change may result from both changes in physical quantity and quality • Although physical land area of a country changes little over time, "It is generally assumed in economic analysis that whenever a difference in price is found between two goods and services that appear to be physically identical there must be some other factor, such as location, timing or conditions of sale, that is introducing a difference in quality".(2008 SNA, para 15.67) • Effects include land degradation, deforestation, reforestation, land improvement and rezoning
Land degradation: experimental estimates for Australia • Kemp and Connell (2001) combined data from a farm survey with land value data to estimate the difference in the capital value of farms with and without degradation at $14.2 billion in 1999 • A second study, the National Land and Water Resources Audit (2002), used models to estimate the lost profit at full equity (PFE) due to soil degradation at $2.6 billion in 1996–97
Subsoil assets Included in the ASNA balance sheet when.. • they have a high geological assurance • extraction is expected to be profitable at the prevailing price and technology, and • they are owned by an economic entity (usually the government). • In the ASNA, economic demonstrated resources (EDR) include both proven and probable reserves • There are 27 minerals included on the Australian balance sheet, including coal, oil and natural gas reserves
Valuing subsoil assets • ASNA uses the net present value (NPV) approach n RRt Vt = Σ t=1 (1+r)t V = net present value, RR = resource rent, r = discount rate, n = asset life • Asset life equals EDR at the end of the year divided by the five year moving average of production. • The discount rate used is the "large business borrowing rate", as published by the Reserve Bank of Australia, converted to a real rate. This rate represents the opportunity cost of the mining companies funds invested in extraction.
Resource rent (RR) • The value of capital service flows or the share of gross operating surplus, rendered by the subsoil assets being exploited. • RR = (p - c) * Q p = average price received per unit, c = average cost per unit (including a normal return to produced capital) Q = quantity extracted • Costs per unit volume have been provided by AME, while prices per unit volume are from publicly available information sources such as ABARE, London Metal Exchange, and London Bullion Market Association.
Valuing subsoil asset depletion • Economic depletion (not physical) arises when the value of a resource stock has been lowered through its use in a productive activity, and the use has reduced the asset's ability to produce an income stream in the future. • The depletion in any one year is the change in the value of the asset between the beginning and end of the year arising purely from the extraction of minerals.
Production Adjusted for depletion and degradation, Current Prices ABS data available on request, Australian National Accounts