Download
1 / 18
200 likes | 435 Views
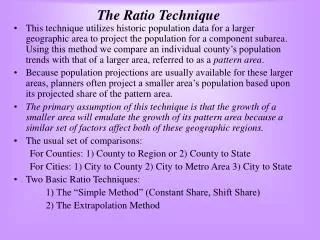
The Ratio Technique. This technique utilizes historic population data for a larger geographic area to project the population for a component subarea. Using this method we compare an individual county’s population trends with that of a larger area, referred to as a pattern area .

E N D
The Ratio Technique • This technique utilizes historic population data for a larger geographic area to project the population for a component subarea. Using this method we compare an individual county’s population trends with that of a larger area, referred to as a pattern area. • Because population projections are usually available for these larger areas, planners often project a smaller area’s population based upon its projected share of the pattern area. • The primary assumption of this technique is that the growth of a smaller area will emulate the growth of its pattern area because a similar set of factors affect both of these geographic regions. • The usual set of comparisons: For Counties: 1) County to Region or 2) County to State For Cities: 1) City to County 2) City to Metro Area 3) City to State • Two Basic Ratio Techniques: 1) The “Simple Method” (Constant Share, Shift Share) 2) The Extrapolation Method
The Ratio “Simple Method” • This method takes historical data for a county and compares it to the pattern area by calculating a ratio. The ratio for each of the observation years is: County Pop/Pattern Area Pop • A visual analysis of the trends in this changing ratio provide the evidence for establishing a ratio for the projection time period. • Then, using population projections for the pattern area and the projected ratio, population projections are generated for the county. • A convention with the Ratio Technique is to calculate Low, Medium, and High population projections when possible. These different projections are usually taken from the projection set prepared for the pattern area.
The Ratio “Simple Method” • The Basic Procedure is: Step 1) Gather data Step 2) Calculate observed ratios Step 3) Project future ratios through qualitative analysis Step 4) Project future population using ratios • Constant Share Method: A smaller area’s share of the larger area’s population is held constant at some historical level. • Shift Share Method: This method accounts for changes in population share over time. This assumes that changes in share between the Base Year and the Launch Year predict future changes in the share. • Share-of-Growth Method: This method focuses upon population growth, not the share of growth. This method uses a smaller area’s share of growth as the primary means for predicting future populations.
Shift Share Method (1) (3) (2) Step 1: Calculate the Shift Share Step 2: Project the Future Share Step 3: Calculate the Population Projection
Florida Regional Planning Councils 1 2 3 4 5 6 7 8 9 10 11 West Florida Regional Planning Council Escambia, Santa Rosa, Okaloosa, Walton, Bay, Holmes, Washington Apalachee Regional Planning Council Calhoun, Franklin, Liberty, Wakulla, Leon, Gadsden, Jackson, Gulf, Jefferson North Central Florida Regional Planning Council Alachua, Union, Bradford, Gilchrist, Columbia, Dixie, Hamilton, Madison, Suwannee, Taylor, Lafayette Northeast Florida Regional Planning Council Baker, Clay, Duval, Flagler, Nassau, Putnam, St. Johns Withlacoochee Regional Planning Council Citrus, Hernando, Levy, Marion, Sumter East Central Florida Regional Planning Council Brevard, Lake, Orange, Volusia, Osceola, Seminole Central Florida Regional Planning Council DeSoto, Hardee, Highlands, Okeechobee, Polk Tampa Bay Regional Planning Council Hillsborough, Manatee, Pasco, Pinellas Southwest Florida Regional Planning Council Charlotte, Collier, Glades, Hendry, Lee, Sarasota Treasure Coast Regional Planning Council Indian River, Martin, Palm Beach, St. Lucie South Florida Regional Planning Council Broward, Dade, Monroe
The Ratio Extrapolation Method • This method is very similar to the previously discussed extrapolation technique, except that instead of inputting observed population figures the method calls for the observed ratios to be the inputs. • Another key thing to remember is that Inputs are a Ratio and the Outputs are a Ratio, so an additional step is required to turn the outputs into population projections that make sense. • The extrapolation method utilizes all six curves and even uses the same set of evaluation techniques (CRV, ME, MAPE). • However, some of the “rules” have changed: 1) In areas with declining ratios the asymptotic curves can sometimes be unable to calculate the “best fitting” curve. 2) In calculating the CRV, you do not multiply by 100. 3) Values for the Mean Error will be very low, but still should be compared.
Evaluating the Ratio Technique • What are the advantages to this technique? 1) Takes into account regional or statewide factors driving local population changes. 2) Regional or state trends are often much more stable than local trends (and stability aids predictability). 3) This approach can “smooth out” local population trends, making them easier to fit these trends to the various curves. 4) Can utilize high-quality projections developed for larger geographic areas (the pattern areas). 5) Can utilize the various sets of pattern area projections to develop Low, Medium and High projections for the study area. • The primary disadvantages are: 1) The continued assumption that past trends dictate future figures2) The complexity of the techniques