SPSS WORKSHOP
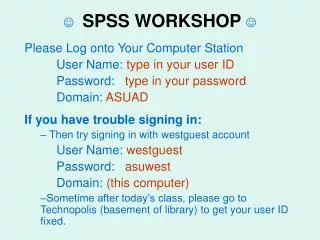
SPSS WORKSHOP . Please Log onto Your Computer Station User Name: type in your user ID Password: type in your password Domain: ASUAD If you have trouble signing in: Then try signing in with westguest account User Name: westguest Password: asuwest

SPSS WORKSHOP
E N D
Presentation Transcript
SPSS WORKSHOP Please Log onto Your Computer Station User Name: type in your user ID Password: type in your password Domain: ASUAD If you have trouble signing in: Then try signing in with westguest account User Name: westguest Password: asuwest Domain: (this computer) Sometime after today’s class, please go to Technopolis (basement of library) to get your user ID fixed.
Laptops • You can move the laptop to where ever you want to sit. • If the laptop gives you a warning that the battery is running low, we have extra laptops you can switch with. • If the laptops are not frequently used then they will go to sleep. So please move your mouse every few minutes. • If the laptops happen to fall asleep (or shut down), • please push the power button, which is located at top left hand corner of your keyboard. • Then you will have to retype in the password. • There is a sign in sheet going around the room for the laptops. Each lap top has a unique identification number located behind the screen. Please put your name next to the laptop you are using
Workshop IIData Analyses with SPSS Roger Berger Mathematical Sciences & Applied Computing Department Rico Rivera Heather Ohton Tommy Aguila Christopher Zambakari Statistics Laboratory http://www.west.asu.edu/StatLab
Workshop II: Overview (p. 1) • Function of Stat Lab • Review of basic function of SPSS Data Editor • Complete survey and enter data • Brief review of how variables were edited in “variable view” • Transforming variables in SPSS • Create composite scores • Reverse scoring • Syntax • Keeping track of data manipulation and analyses • Syntax window • Repeat of descriptive statistics • Level of measurement • Summarizing distributions of variables • Central tendency and variability (dispersion) • Relational and inferential statistics • Relationships: cross tabulations and relationships • Inferential statistics (t-tests) • Stat Lab resources • Online resources: survey design • Our reference library
Open up your internet Explorer http://www.west.asu.edu/StatLab • Click on Workshops • Click on Data used for SPSS Workshops • Click on Fin_Health_SWG693 • Please save it in your Desktop. • Close the internet browser.
SPSS Accessibility (p. 3) • Network access • Technopolis (basement of library) • Desktop (hard drive) installed • Computer Classrooms • Stat Lab • Software versions can be purchased at the Bookstore • Student Edition: (SE) (has limitations). ~80.00 • Grad Pak: (has much more features) • ~215.00 • only graduate students can get it • Can download price list from: http://bookstore.asu.edu/computers/index.php
Accessing the Statistic Laboratory • Location: CLCC 107 • Phone: (602) 543-6117 • Website: http://www.west.asu.edu/StatLab • Operating hours: See website • When using the lab, please sign in at the front counter
Support for Statistics (p. 4) • Function of Stat Lab (also pp. 5-7) • The Stat Lab staff assists students with aspects of statistical software. • The Stat Lab is not set up to provide one-on-one tutorial service for students on a regular basis. • However, we have and frequently do answer general statistic questions. • Statistics Tutoring • Learning Enhancement Center • TRiO (SSS) program
Please fill out the survey (Remove the last page of your handout) • Response • Strongly Disagree • Disagree • Agree • Strongly Agree • Sex • Male • Female • Age • Response • Strongly Disagree = 1 • Disagree = 2 • Agree = 3 • Strongly Agree = 4 • Sex • Male = 1 • Female = 2 • Age Actual age in years • Having ID column will help you keep track of cases • What do the 1st five questions measure? • What do the 2nd five questions measure?
Please launch SPSSthen Turn to Page 10 of Handout • Menu Bar • Data & Transform are used to manipulate the data in data editor (i.e., spread sheet) • Analyze and Graphs are used to create output • Tabs (bottom left hand corner of data editor) • Data View (top panel) • Columns: Variables (e.g., questions on survey) • Rows: Cases (e.g., survey) • Variable View (bottom panel) • How we edit the variables • Give variables their names, labels, etc
Variable View • Click on Variable View • Tab (located lower left hand corner) • Pages 12 – 13 of your handout • Variable Name • Numeric • Width • Decimal • Variable Label • Value Label • Missing • Column • Align • Measure
Variable View • Variable View • Tab (located lower left hand corner) • Pages 12 – 13 of your handout • Variable Name • Numeric • Width • Decimal • Variable Label • Value Label • Missing • Column • Align • Measure
Open a new data file • Now we are going to open up a data set. • File > open > Data • Navigate to your desktop • Open up the data file that you downloaded from our website.
Overview of Next Section of Workshop • Transforming Variables • Syntax File • Descriptive Statistics • Central Tendency • Dispersion (Variability) • Presentation of Data: tables & figures • Making inferences to a Population • Relationships and Statistical Tests • Cross-tabulations and Chi Square • Correlations • Independent Sample t-test • Other Useful information in packet
Transforming Variable (p 14) • Recode • Data may be need to be recoded for a variety of reasons • Examples • Common for reversing the scales • Converting a continuous variable into discrete ordinal variable • Transform > Recode > Into Different Variables • Computing a New Variable • Can create new variables that may be a function of pre-existing variables • Transform > Compute
Financial Stability Composite Scale • Person A has extremely “low” financial Stability. • How you think he would answer questions f01 through f05? • SD A D SA? • However, person B owns a very profitable business. • How do you think she would answer items f01 through f05 ? • SD A D SA?
Health Service Accessibility Composite Scale • What if person B also has high Health Service Accessibility ? • She has great medical benefits and can get free services from her sister’s medical practice • How do you think she would answer the Access to Health Service questions?
Reverse Scoring • What is the reverse scores for h10? revh10 h10 • 1 2 • 3 • 4 • • • • 4 3 • 2 • 1
Look at the SPSS in data view • Why is the variable called “revh10”? • Reverse of h10 • "cannot get the medicines I need" with scoring reversed. • What is the variable “finance”? • Finance Composite: f01+f02+f03+f04+f05 • Construct: “Financial Stability” • What is the variable “health”? • Heath Composite: h06 + h07 + h08 + h09 + revh10 • Construct: “Accessibility to Health Services”
Lets Create a Composite Score • Make sure that you are in “data view” tab • Click on Transform > Compute
Overview Analyzing Data & Creating Graphs • Level of Measurement • Descriptive Analysis • Presentation of Data • Central Tendency & Variability
What are the Levels of Measurement? (p. 16) Ratio (e.g.., sex, ethnicity, agency, location): • Different Categories • numerical values just "name" the attribute uniquely • NOT Rankable • We don't assume that higher values mean "more" of something and lower numbers signify "less". (e.g., income, weights, volumes, capacities, rates): • Different categories • Rankable categories • Constant equal-sized Intervals • Absolute Zero (physical significance) (e.g., temperature in Kelvin, time) • construct a meaningful fraction (or ratio) with a ratio variable Interval (temperature on Celsius and Fahrenheit): • Different categories • Rankable categories • Constant equal-sized Intervals • can be expressed numerically • the distance between attributes does have meaning Ordinal (e.g.., education attainment, class status): • Different Categories • Categories are rankable: (attributes can be rank-ordered) • Intervals are NOT equal-sized • But is distance from 0 to 1 same as 3 to 4? • Distances between attributes do not have any meaning. • We don't assume the value of 2 means that sophomores are twice something than freshman are. Nominal
Descriptive Statistics • Presentation of entire distribution • Frequency Distribution: organized tabulation of the number (or percentage) of individuals in each category on the scale of measurement • Can be presented in a table or in a graph • Measures of Central Tendency • Identifies a single score that represents an entire data set • Best example of average or most typical score • Measures of Variability (Dispersion) • Provides a description of how spread out the scores are in a distribution • Provides a measure of how accurately a single score selected from a distribution represents the entire set
Back to SPSS • Create table frequency & a chart • Create measures of central tendency • Create measures of dispersion
How can we summarize the distribution of the below variable? Gender • Male • Female What is the level of measurement? (see page 16, 1st slide) Nominal Should we use a bar graph or a histogram? (see page 16, 2nd slide) Bar Graph
Presentation of an Nominal Variable • Click Analyze > click Descriptive Statistics > then click Frequencies. • You should see a dialog box called Frequencies. • On the left side you should see a list of variables and on the right you should see a Variable(s) box. • In the variable list (left side) look for a variable either called “Gender” or sex. • Select this variable by clicking on it, then click ►to place the variable in the Variable(s) box. • Make sure that there is a check marknext to Display frequency tables. • Click Charts. • You will see a dialog box called Frequencies: Charts • Click Bar Charts. Click Continue. • Click OK.
Frequency and Percentage Distribution of Gender (N=96)* *Missing Cases = 2
We want to know the central tendency for the below variables. (p 18) • Age of respondent 18 – 89. Actual age in years What is the level of measurement? Which measure of central tendency should we use? (see page 16, 3rd slide)
Central Tendency & Variability for Interval & Ratio Variable • Click Analyze > click Descriptive Statistics > then click Descriptive. • You will see a dialog box called Descriptives. • Select the variable • one is called “AGE”. • Click Options. You will see a dialog box called Descriptives: Options • By default Mean,Std Deviation, Minimum, & Maximum should be selected • click Continue. • Click OK.