Download
1 / 17
170 likes | 441 Views
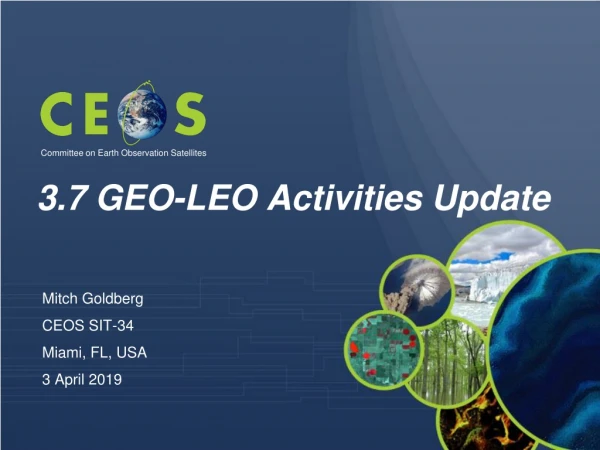
3.7 GEO-LEO Activities Update. Committee on Earth Observation Satellites. Mitch Goldberg CEOS SIT-34 Miami, FL, USA 3 April 2019. GEO-LEO Activities Update. CSIRO CEOS Chair Study on Non-Meteorological Applications (2016) NOAA SIT Chair Priority(2018 – 2019)

E N D
3.7 GEO-LEO Activities Update Committee on Earth Observation Satellites • Mitch Goldberg • CEOS SIT-34 • Miami, FL, USA • 3 April 2019
GEO-LEO Activities Update • CSIRO CEOS Chair Study on Non-Meteorological Applications (2016) • NOAA SIT Chair Priority(2018 – 2019) • CGMS lead on Flood Mapping Pilot • CSIRO/GA SIT Chair Proposed Priority (2020-2021)
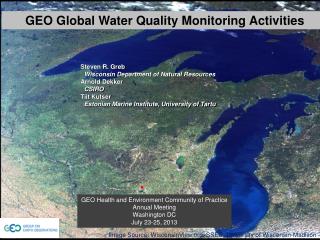
Prototype case study included data for ARD tile in eastern Montana from the Landsat OLI, Terra and Aqua MODIS, Sentinel-2 MSI, Suomi-NPP VIIRS, and GOES-16 ABI, and in situ networks. Data included Visible and Near-IR Reflectance, Normalized Difference Vegetation Index, and Land Surface Temperature. A land application case study proposed: Multi-Sensor Monitoring of Vegetation Condition. GEO-LEO Activities Update Land Surface Case Study
GEO-LEO Activities Update Land Surface Case Study Why Visible and Near-IR Reflectance, Normalized Difference Vegetation Index, and Land Surface Temperature products? Societal Benefit Areas and Land Applications that utilize these data/products.
GEO-LEO Activities Update Land Surface Case Study • Next Steps: • USGS and NOAA seek to initiate proposed case study (Montana test site) in early US FY 2020 • Explore additional land surface case studies in different regions with more CEOS members • VCs and WGs requested to consider their respective contributions (e.g., additional test sites, data/products) Must underscore the importance of Analysis Ready Data to enable easier development or applications use of the data.
Floods events have the highest frequency and most damaging impact of all natural disasters. New operational weather satellites such as JPSS, GOES-R, HIMAWARI, FY3D, FY4A for the very first time have the spectral bands for inundation mapping and large geographic and temporal coverage. These satellites have real-time distribution capabilities allowing fast generation and utilization of disaster products for critical decision making. The operational polar satellites have direct broadcast and the geostationary satellites have direct broadcast, rebroadcast, and/or cloud services for immediate access to data. CGMS Flood Pilot: To bring the new operational GEO and LEO to the “flood” imagery/mapping constellation
GEO and LEO Interplay GOES-16 ABI 1 km flood map will provide early situational awareness; The higher spatial resolution JPSS VIIRS (375 meters) will provide finer more accurate details, however the product is not available until 3 – 4 pm (daylight time) – JPSS is an afternoon satellite
Russia flood Lena River: May 16, 2018 (119 deg E to 135 deg E, 59 deg N to 66 Deg N) Argentina flood: May 09 to 11, 2018 (64 deg W to 54 deg W, 36 deg S to 23 deg S) Southeast Asia flood (India, Bangladesh, Mynamar and Cambodia): Aug. 18 to 23, 2018 (73 deg E to 109 deg E, 8 deg N to 23 Deg N) Venezuela flood: Aug. 20 to 27, 2018 (71 deg W to 60 deg W, 2 deg N to 10 deg N) China flood in Shandong and Jiangsu: Aug. 23 to 27, 2018 (114 deg E to 123 deg E, 32 deg N to 39 Deg N) Philippines flood: Sep. 17 to 29, 2018 (110 deg E to 122 deg E, 8 deg N to 25 Deg N) Flood in North Carolina from Sep.18 to 21, 2018 (84 deg W to 73 deg W, 30 deg N to 41 deg N) China flood in Heilongjiang Province during rice paddy planting season: May 03 to May 15, 2018 (118 to 137 deg E, 38 to 52 deg N) 8 Cases – Pilot Study
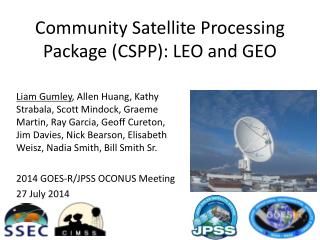
First FY4D (AGRI- GEO) results Himawari FY4D
~ 10 hour composite Himawari FY4D
Complete CGMS Pilot Study and Assessment and report results to SIT Technical Workshop • Discuss with JMA (HIMAWARI) on implementation for their region, or with a NHMS. • NOAA SIT Chair Team to further coordinate with WGDisasters and WGCapD to: • Explore possible future CEOS project(s) combine Sentinel 1 with GEO/LEO optical/IR • Focus on outcomes - NOAA operations, Copernicus Emergency Service Flood Map Next Steps/Actions