Download
1 / 35
350 likes | 439 Views
Explore spatial relationships between surface temperatures, ENSO, and SAM modulation using self-organizing maps (SOMs) with a dataset from the Polar MM5 model. Investigate the impact of SAM/ENSO states on temperature patterns and assess anthropogenic and natural influences. Next steps include comparison with other methodologies and further analysis of the data.

E N D
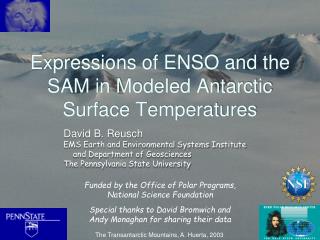
Expressions of ENSO and the SAM in Modeled AntarcticSurface Temperatures David B. Reusch EMS Earth and Environmental Systems Institute and Department of Geosciences The Pennsylvania State University Funded by the Office of Polar Programs, National Science Foundation Special thanks to David Bromwich and Andy Monaghan for sharing their data The Transantarctic Mountains, A. Huerta, 2003
Introduction • Questions • Are there robust spatial relationships between surface temperatures and ENSO/SAM? • Does SAM modulate the ENSO fingerprint? • Methods • Extract patterns of variability in temperature and circulation data (SOMs) • Stratify data by SAM/ENSO states and hope there’s something to interpret in the patterns Background ● ENSO● Land-only T-2m ● SAM ● T <= SAM,ENSO
The Model Dataset • Polar MM5 initialized by ERA-40 • Jan 1979 - Aug 2002 • 60 km grid, 6-hourly • Daily averages, DJF (Jul) • T-2m (Z850, Z700, Z500) • See Monaghan et al, 2006 Grid Domain Background ● ENSO● Land-only T-2m ● SAM ● T <= SAM,ENSO
Self-organizing Maps (SOMs) 1) Generalized pattern extractor Concise summary of data variability expressed as a user-defined number of generalized patterns Patterns arranged in a grid by their relative similarity Each input record matches one pattern most closely Holocene ice core chemistry Background ● ENSO● Land-only T-2m ● SAM ● T <= SAM,ENSO
Self-organizing Maps (SOMs) 2) Data classifier by pattern matching Group input records that match the same pattern; use pattern instead Basis for frequency, transition and trajectory maps Subset input by time period, external index, etc. Sample Frequency Map Background ● ENSO● Land-only T-2m ● SAM ● T <= SAM,ENSO
125 m 200 m Background● ENSO ● Land-only T-2m ● SAM ● T <= SAM,ENSO
Seasonal Land-Only Temperatures • Broadening study period • Switch to land-only • Focus on ice sheet • Ocean temperatures of less interest • Still daily resolution Background● ENSO● Land-only T-2m ● SAM ● T <= SAM,ENSO
Land-only Surface Temperature Climatology Background● ENSO● Land-only T-2m ● SAM ● T <= SAM,ENSO
SAM and Temperature • Create data subsets using high/low values of the SAM index • Create frequency maps for each year in each subset • Identify which pattern frequencies are statistically unusual • Count how often each pattern is unusual Background● ENSO● Land-only T-2m ● SAM ● T <= SAM,ENSO
40 °S Marshall SAM Index, J. Climate 2003 http://www.antarctica.ac.uk/met/gjma/sam.html 65 °S Background● ENSO● Land-only T-2m ● SAM ● T <= SAM,ENSO
80% 20%
T = f(ENSO) og(SAM)? r2 ~ 0 Background● ENSO● Land-only T-2m ● SAM ● T <= SAM,ENSO
December 1982 Low SAM/El Niño
December 1994 High SAM/El Niño
Potential Next Steps • Work with READER data • Not high spatial density like a model grid… • But the records are longer • Then again, it’s monthly not daily… • Other fields that express the SAM • Compare notes with those using other methodologies!
Summary dbr120@psu.edu NSF ANT 06-36618 Intriguing signatures of both El Niño and the SAM are in the data Untangling joint effects SAM/ENSO remains a challenging task
J-M05 Manifestation of anthropogenic forcing and natural variability in the Arctic and Antarctic climate systems June 28 – July 11, Melbourne, AUS www.iugg2011.com Call for Abstracts still TBA