Advanced Cache Coherence Simulation Using GEMS for High-Performance Multiprocessor Systems
This document explores advanced cache coherence simulation using the GEMS (Generic Execution Management System). Caches are vital for maintaining efficiency in multiprocessor architectures, which require consistency across multiple caches. We highlight various cache coherence protocols, the significance of simulation in validating their correctness, and explore tools like Ruby, Opal, and Simics for effective cache coherence modeling. Additionally, we provide installation guidelines and discuss simulation results, focusing on performance metrics and benchmarking of cache coherence interactions in a simulated environment.


Advanced Cache Coherence Simulation Using GEMS for High-Performance Multiprocessor Systems
E N D
Presentation Transcript
Cache Coherence Simulation using GEMS Adam Dyess Dennis Cox
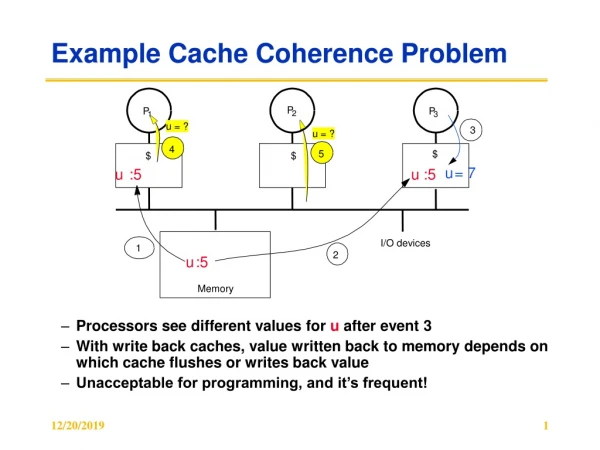
Cache Coherence • Caches are essential for high-performance • Multiprocessor has many caches to keep consistent. • Cache Coherence Protocols • Dependent on architecture and applications • Can be difficult to validate correctness • Simulation is invaluable
Cache Coherence Simulators • LIMES • RSIM • M5 • ccSIM • TLA+/TLC
GEMS Overview • Fully Functional simulation • Timing focus; Simics handles functionality • Ruby - Memory simulator • Cache coherence protocol • Interconnection network • Memory architecture • Opal - Out of Order execution simulator
SLICC • Specification Language for Implementing Cache Coherence • Protocol specified using • States • Events • Actions • Transitions
Installation (SIMICS) • Assessing the Host Machine • Acquiring a Simics License • Downloading Simics • Follow Simics Installation Instructions • Test Simics
Preparing Simics • Install Solaris • Edit the Hardware Configuration • Create CDROM Image if you want to import pre-compiled information • Load the CDROM Image file into the Hardware Configuration • Startup New Hardware • Save Checkpoint
Installation (GEMS) • Download and Install • Copy Simics into GEMS directory • Compile Ruby, Opal, and a Cache Coherency Protocol • Startup Simics • GEMS documentation is excellent at describing how to start simics using the newly compiled cache coherency protocol. • http://www.cs.wisc.edu/gems/doc/wiki/moin.cgi • Load the Checkpoint • Init Ruby (and optionally opal)
Pitfalls • Getting files in and out of Simics • Setting RUBY parameters properly • Simics over XWindows
Tested Simulation • Heat Distribution Problem built on PTHREADS • The operating system would disperse the 8 threads onto 8 different processors • Each thread swapped data using shared memory • Barriers were also used to synchronize the threads’ sharing
Simulation Results? L1_REQUEST_LATENCY: 2 L2_REQUEST_LATENCY: 4 SINGLE_ACCESS_L2_BANKS: true SEQUENCER_TO_CONTROLLER_LATENCY: 4 L1CACHE_TRANSITIONS_PER_RUBY_CYCLE: 32 L2CACHE_TRANSITIONS_PER_RUBY_CYCLE: 32 DIRECTORY_TRANSITIONS_PER_RUBY_CYCLE: 32 g_SEQUENCER_OUTSTANDING_REQUESTS: 16 NUMBER_OF_TBES: 128 NUMBER_OF_L1_TBES: 32 NUMBER_OF_L2_TBES: 32 FINITE_BUFFERING: false FINITE_BUFFER_SIZE: 3 PROCESSOR_BUFFER_SIZE: 10 PROTOCOL_BUFFER_SIZE: 32 TSO: false g_MASK_PREDICTOR_CONFIG: AlwaysBroadcast g_TOKEN_REISSUE_THRESHOLD: 2 g_PERSISTENT_PREDICTOR_CONFIG: None g_NETWORK_TOPOLOGY: HIERARCHICAL_SWITCH g_CACHE_DESIGN: NUCA g_endpoint_bandwidth: 10000 g_adaptive_routing: true NUMBER_OF_VIRTUAL_NETWORKS: 4 FAN_OUT_DEGREE: 4 g_PRINT_TOPOLOGY: false [Profiler printConfig] Network Configuration Profiler Stats -------------- Elapsed_time_in_seconds: 8368 Elapsed_time_in_minutes: 139.467 Elapsed_time_in_hours: 2.32444 Elapsed_time_in_days: 0.0968519 Ruby_current_time: 26376000 Ruby_start_time: 1 Ruby_cycles: 26375999 mbytes_resident: 232.309 mbytes_total: 247.68 resident_ratio: 0.937987 L1D_cache cache stats: L1D_cache_total_misses: 28732 L1D_cache_total_demand_misses: 28732 L1D_cache_total_prefetches: 0 L1D_cache_total_sw_prefetches: 0 L1D_cache_total_hw_prefetches: 0 L1D_cache_misses_per_transaction: 28732 L1D_cache_misses_per_instruction: 7.66225e-05 L1D_cache_instructions_per_misses: 13051 L1D_cache_request_type_LD: 51.3156% L1D_cache_request_type_ST: 43.0565% L1D_cache_request_type_ATOMIC: 5.62787% Requests of asi 0x4: 191870 Requests of asi 0x10: 10080 Requests of asi 0x11: 7735 Requests of asi 0x14: 893 Requests of asi 0x24: 5066 Requests of asi 0x71: 90 Requests of asi 0x80: 463460432 Requests of asi 0xf0: 9883 Simics Driver Transaction Results Stats ------------------------------------------ Fast path: 463618487 Request missed: 50274 Sequencer not ready: 0 Duplicate instruction fetches: 21541 Hit return: 27115 Atomic last accesses: 1617 Chip Stats ---------- --- L1Cache --- - Event Counts - Load 14744 Ifetch 21542 Store 13988 L1_to_L2 37772 L2_to_L1D 7442 L2_to_L1I 14520 outgoing_messages_switch_21_link_3_Data: 578 41616 [ 0 578 0 0 ] base_latency: 14 switch_22_inlinks: 1 switch_22_outlinks: 4 links_utilized_percent_switch_22: 0.249035 links_utilized_percent_switch_22_link_0: 0.102994 bw: 10000 base_latency: 14 links_utilized_percent_switch_22_link_1: 0.183767 bw: 10000 base_latency: 14 links_utilized_percent_switch_22_link_2: 0.575514 bw: 10000 base_latency: 14 links_utilized_percent_switch_22_link_3: 0.133867 bw: 10000 base_latency: 14 outgoing_messages_switch_22_link_0_Control: 28512 228096 [ 28512 0 0 0 ] base_latency: 14 outgoing_messages_switch_22_link_0_Data: 605 43560 [ 0 605 0 0 ] base_latency: 14 outgoing_messages_switch_22_link_1_Control: 28512 228096 [ 28512 0 0 0 ] base_latency: 14 outgoing_messages_switch_22_link_1_Data: 3564 256608 [ 0 3564 0 0 ] base_latency: 14 outgoing_messages_switch_22_link_2_Control: 28512 228096 [ 28512 0 0 0 ] base_latency: 14 outgoing_messages_switch_22_link_2_Data: 17915 1289880 [ 0 17915 0 0 ] base_latency: 14 outgoing_messages_switch_22_link_3_Control: 28512 228096 [ 28512 0 0 0 ] base_latency: 14 outgoing_messages_switch_22_link_3_Data: 1736 124992 [ 0 1736 0 0 ] base_latency: 14 switch_23_inlinks: 1 switch_23_outlinks: 4 links_utilized_percent_switch_23: 0.0105899 links_utilized_percent_switch_23_link_0: 0.0101183 bw: 10000 base_latency: 14 links_utilized_percent_switch_23_link_1: 0.0107613 bw: 10000 base_latency: 14 links_utilized_percent_switch_23_link_2: 0.00997877 bw: 10000 base_latency: 14 links_utilized_percent_switch_23_link_3: 0.0115014 bw: 10000 base_latency: 14 outgoing_messages_switch_23_link_0_Control: 3336 26688 [ 3336 0 0 0 ] base_latency: 14 outgoing_messages_switch_23_link_1_Control: 3548 28384 [ 3548 0 0 0 ] base_latency: 14 Ruby Configuration ------------------ protocol: MOSI_SMP_bcast simics_version: simics-2.0.28 compiled_at: 12:22:02, Mar 16 2005 RUBY_DEBUG: false hostname: eb22909.eng.uah.edu g_RANDOM_SEED: 1 g_DEADLOCK_THRESHOLD: 50000 g_FORWARDING_ENABLED: false RANDOMIZATION: false g_SYNTHETIC_DRIVER: false g_DETERMINISTIC_DRIVER: false g_FILTERING_ENABLED: false g_DISTRIBUTED_PERSISTENT_ENABLED: true g_DYNAMIC_TIMEOUT_ENABLED: true g_RETRY_THRESHOLD: 1 g_FIXED_TIMEOUT_LATENCY: 300 g_trace_warmup_length: 1000000 g_bash_bandwidth_adaptive_threshold: 0.75 g_tester_length: 0 g_synthetic_locks: 2048 g_deterministic_addrs: 1 g_SpecifiedGenerator: DetermInvGenerator g_callback_counter: 0 g_NUM_COMPLETIONS_BEFORE_PASS: 0 g_think_time: 5 g_hold_time: 5 g_wait_time: 5 PROTOCOL_DEBUG_TRACE: true prefetch_latency: [binsize: 1 max: 0 count: 0 average: NaN |standard deviation: NaN | 0 ] prefetch_latency_L2Miss:[binsize: 1 max: 0 count: 0 average: NaN |standard deviation: NaN | 0 ] multicast_retries: [binsize: 1 max: 0 count: 0 average: NaN |standard deviation: NaN | 0 ] gets_mask_prediction_count: [binsize: 1 max: 0 count: 0 average: NaN |standard deviation: NaN | 0 ] getx_mask_prediction_count: [binsize: 1 max: 0 count: 0 average: NaN |standard deviation: NaN | 0 ] explicit_training_mask: [binsize: 1 max: 0 count: 0 average: NaN |standard deviation: NaN | 0 ] conflicting_histogram: [binsize: log2 max: 26374003 count: 28512 average: 1.38371e+07 | standard deviation: 1.55252e+07 | 0 0 0 5 0 0 0 0 1 8 9 19 38 63 72 0 0 0 0 0 116 1136 398 7457 8077 11113 ] conflicting_histogram_percent: [binsize: log2 max: 26374003 count: 28512 average: 1.38371e+07 | standard deviation: 1.55252e+07 | 0 0 0 0.0175365 0 0 0 0 0.0035073 0.0280584 0.0315657 0.0666386 0.133277 0.22096 0.252525 0 0 0 0 0 0.406846 3.98429 1.3959 26.1539 28.3284 38.9766 ] Request Profile --------------- I M GETS 885 3.10396 I M GETX 118 0.413861 I M GET_INSTR 2 0.00701459 I OS GETS 322 1.12935 I OS GETX 5 0.0175365 I OSS GETS 1192 4.1807 I OSS GETX 17 0.059624 NP C GETS 5813 20.3879 NP C GETX 9244 32.4214 NP C GET_INSTR 4656 16.33 outgoing_messages_switch_7_link_0_Control: 1788 14304 [ 1788 0 0 0 ] base_latency: 14 outgoing_messages_switch_7_link_0_Data: 466 33552 [ 0 466 0 0 ] base_latency: 14 switch_8_inlinks: 1 switch_8_outlinks: 1 links_utilized_percent_switch_8: 0.0817288 links_utilized_percent_switch_8_link_0: 0.0817288 bw: 10000 base_latency: 14 outgoing_messages_switch_8_link_0_Data: 2994 215568 [ 0 2994 0 0 ] base_latency: 14 switch_9_inlinks: 1 switch_9_outlinks: 1 links_utilized_percent_switch_9: 0.0821929 links_utilized_percent_switch_9_link_0: 0.0821929 bw: 10000 base_latency: 14 outgoing_messages_switch_9_link_0_Data: 3011 216792 [ 0 3011 0 0 ] base_latency: 14 switch_10_inlinks: 1 switch_10_outlinks: 1 links_utilized_percent_switch_10: 0.0805005 links_utilized_percent_switch_10_link_0: 0.0805005 bw: 10000 base_latency: 14 outgoing_messages_switch_10_link_0_Data: 2949 212328 [ 0 2949 0 0 ] base_latency: 14 switch_11_inlinks: 1 switch_11_outlinks: 1 links_utilized_percent_switch_11: 0.0836397 links_utilized_percent_switch_11_link_0: 0.0836397 bw: 10000 base_latency: 14 outgoing_messages_switch_11_link_0_Data: 3064 220608 [ 0 3064 0 0 ] base_latency: 14 switch_12_inlinks: 1 DEBUG_FILTER_STRING: none DEBUG_VERBOSITY_STRING: none DEBUG_START_TIME: 0 DEBUG_OUTPUT_FILENAME: none SIMICS_RUBY_MULTIPLIER: 2 OPAL_RUBY_MULTIPLIER: 2 TRANSACTION_TRACE_ENABLED: false USER_MODE_DATA_ONLY: false PROFILE_HOT_LINES: false PROFILE_ALL_INSTRUCTIONS: false PRINT_INSTRUCTION_TRACE: false BLOCK_STC: false PERFECT_MEMORY_SYSTEM: false DATA_BLOCK: false REMOVE_SINGLE_CYCLE_DCACHE_FAST_PATH: false g_SIMICS: true L1_CACHE_ASSOC: 4 L1_CACHE_NUM_SETS_BITS: 8 L2_CACHE_ASSOC: 4 L2_CACHE_NUM_SETS_BITS: 16 g_MEMORY_SIZE_BYTES: 1073741824 g_DATA_BLOCK_BYTES: 64 g_PAGE_SIZE_BYTES: 4096 g_NUM_PROCESSORS: 8 g_NUM_L2_BANKS: 8 g_NUM_MEMORIES: 8 g_PROCS_PER_CHIP: 1 g_NUM_CHIPS: 8 g_NUM_CHIP_BITS: 3 NP M GETS 453 1.5888 NP M GETX 158 0.554153 NP M GET_INSTR 14 0.0491021 NP OS GETS 33 0.115741 NP OSS GETS 9 0.0315657 NP S GETS 512 1.79574 NP S GETX 22 0.0771605 NP S GET_INSTR 1293 4.53493 NP SS GETS 237 0.831229 NP SS GETX 2 0.00701459 NP SS GET_INSTR 1058 3.71072 O M GETX 1 0.0035073 O OS GETX 301 1.0557 O OSS GETX 235 0.824214 S M GETX 63 0.22096 S OS GETX 538 1.88692 S OSS GETX 78 0.273569 S S GETX 1186 4.15965 S SS GETX 65 0.227974 filter_action: [binsize: 1 max: 0 count: 0 average: NaN |standard deviation: NaN | 0 ] Message Delayed Cycles ---------------------- Total_delay_cycles: [binsize: 1 max: 0 count: 0 average: NaN |standard deviation: NaN | 0 ] Total_nonPF_delay_cycles: [binsize: 1 max: 0 count: 0 average: NaN |standard deviation: NaN | 0 ] virtual_network_0_delay_cycles: [binsize: 1 max: 0 count: 0 average: NaN |standard deviation: NaN | 0 ] virtual_network_1_delay_cycles: [binsize: 1 max: 0 count: 0 average: NaN |standard deviation: misses_per_transaction: 0 [ 0 0 0 0 0 0 0 0 ] Busy Controller Counts: L1Cache-0:0 L1Cache-1:0 L1Cache-2:0 L1Cache-3:0 L1Cache-4:0 L1Cache-5:0 L1Cache-6:0 L1Cache-7:0 Directory-0:0 Directory-1:0 Directory-2:0 Directory-3:0 Directory-4:0 Directory-5:0 Directory-6:0 Directory-7:0 Busy Bank Count:0 L1TBE_usage: [binsize: 1 max: 0 count: 0 average: NaN |standard deviation: NaN | 0 ] L2TBE_usage: [binsize: 1 max: 0 count: 28512 average: 0 | standard deviation: 0 | 28512 ] StopTable_usage: [binsize: 1 max: 0 count: 0 average: NaN |standard deviation: NaN | 0 ] sequencer_requests_outstanding: [binsize: 1 max: 1 count: 50274 average: 1 | standard deviation: 0 | 0 50274 ] store_buffer_size: [binsize: 1 max: 0 count: 0 average: NaN |standard deviation: NaN | 0 ] unique_blocks_in_store_buffer: [binsize: 1 max: 0 count: 0 average: NaN |standard deviation: NaN | 0 ] All Non-Zero Cycle Demand Cache Accesses ---------------------------------------- miss_latency: [binsize: 4 max: 610 count: 50274 average: 113.155 | standard deviation: 97.9074 | 0 21762 0 0 0 0 0 0 0 0 0 0 0 0 0 0 430 104 1 0 0 0 0 0 0 0 0 0 0 0 0 0 0 0 2383 63 332 164 131 238 23 246 5 150 2 23 8 0 0 0 1 21736 100 1846 10 164 119 10 94 2 41 0 15 0 0 0 0 0 0 1 27 1 1 2 0 0 0 0 0 0 0 0 0 0 0 0 0 1 15 2 0 0 0 0 0 0 0 0 0 0 0 0 0 0 0 2 11 1 0 0 0 0 0 0 0 0 0 0 0 0 0 0 0 2 3 0 0 0 0 0 0 0 0 0 0 0 0 0 0 0 0 0 1 0 0 0 0 0 0 0 0 0 1 0 0 0 0 0 0 0 0 0 0 0 0 0 0 0 0 0 0 0 0 0 0 0 0 0 ] L1D_cache_access_mode_type_SupervisorMode: 24019 83.5967% L1D_cache_access_mode_type_UserMode: 4713 16.4033% L1D_cache_request_size: [binsize: log2 max: 64 count: 28732 average: 25.3078 | standard deviation: 27.779 | 0 1878 661 7732 8723 0 0 9738 ] L1I_cache cache stats: L1I_cache_total_misses: 21542 L1I_cache_total_demand_misses: 21542 L1I_cache_total_prefetches: 0 L1I_cache_total_sw_prefetches: 0 L1I_cache_total_hw_prefetches: 0 L1I_cache_misses_per_transaction: 21542 L1I_cache_misses_per_instruction: 5.74482e-05 L1I_cache_instructions_per_misses: 17407 L1I_cache_request_type_IFETCH: 100% L1I_cache_access_mode_type_SupervisorMode: 17190 79.7976% L1I_cache_access_mode_type_UserMode: 4352 20.2024% L1I_cache_request_size: [binsize: log2 max: 4 count: 21542 average: 4 | standard deviation: 0 | 0 0 0 21542 ] L2_cache cache stats: L2_cache_total_misses: 28512 L2_cache_total_demand_misses: 28512 L2_cache_total_prefetches: 0 L2_cache_total_sw_prefetches: 0 L2_cache_total_hw_prefetches: 0 L2_cache_misses_per_transaction: 28512 switch_12_outlinks: 1 links_utilized_percent_switch_12: 0.0838581 links_utilized_percent_switch_12_link_0: 0.0838581 bw: 10000 base_latency: 14 outgoing_messages_switch_12_link_0_Data: 3072 221184 [ 0 3072 0 0 ] base_latency: 14 switch_13_inlinks: 1 switch_13_outlinks: 1 links_utilized_percent_switch_13: 0.0812921 links_utilized_percent_switch_13_link_0: 0.0812921 bw: 10000 base_latency: 14 outgoing_messages_switch_13_link_0_Data: 2978 214416 [ 0 2978 0 0 ] base_latency: 14 switch_14_inlinks: 1 switch_14_outlinks: 1 links_utilized_percent_switch_14: 0.0824659 links_utilized_percent_switch_14_link_0: 0.0824659 bw: 10000 base_latency: 14 outgoing_messages_switch_14_link_0_Data: 3021 217512 [ 0 3021 0 0 ] base_latency: 14 switch_15_inlinks: 1 switch_15_outlinks: 1 links_utilized_percent_switch_15: 0.0818653 links_utilized_percent_switch_15_link_0: 0.0818653 bw: 10000 base_latency: 14 outgoing_messages_switch_15_link_0_Data: 2999 215928 [ 0 2999 0 0 ] base_latency: 14 switch_16_inlinks: 4 switch_16_outlinks: 1 cache_set_size_Kbytes: 16 cache_set_size_Mbytes: 0.015625 cache_size_bytes: 65536 cache_size_Kbytes: 64 cache_size_Mbytes: 0.0625 Cache config: L1Cache_0_L2 cache_associativity: 4 num_cache_sets_bits: 16 num_cache_sets: 65536 cache_set_size_bytes: 4194304 cache_set_size_Kbytes: 4096 cache_set_size_Mbytes: 4 cache_size_bytes: 16777216 cache_size_Kbytes: 16384 cache_size_Mbytes: 16 sequencer: STD_Sequencer - SC Store buffer entries: 128 (Only valid if TSO is enabled) memory_bits: 30 memory_size_bytes: 1073741824 memory_size_Kbytes: 1.04858e+06 memory_size_Mbytes: 1024 memory_size_Gbytes: 1 module_bits: 21 module_size_lines: 2097152 module_size_bytes: 134217728 module_size_Kbytes: 131072 module_size_Mbytes: 128 Real time: Apr/20/2005 16:26:33 miss_latency_LD: [binsize: 4 max: 429 count: 14744 average: 122.583 | standard deviation: 91.6827 | 0 5288 0 0 0 0 0 0 0 0 0 0 0 0 0 0 0 0 0 0 0 0 0 0 0 0 0 0 0 0 0 0 0 0 1534 47 302 158 130 237 23 241 4 147 1 23 8 0 0 0 1 5970 19 452 4 54 34 6 31 1 14 0 1 0 0 0 0 0 0 0 9 0 0 2 0 0 0 0 0 0 0 0 0 0 0 0 0 0 1 0 0 0 0 0 0 0 0 0 0 0 0 0 0 0 0 0 1 1 0 0 0 0 0 0 0 0 0 0 0 0 0 0 0 0 0 0 0 0 0 0 0 0 0 0 0 0 0 0 0 0 0 0 ] miss_latency_ST: [binsize: 4 max: 610 count: 12371 average: 177.71 | standard deviation: 66.447 | 0 1258 0 0 0 0 0 0 0 0 0 0 0 0 0 0 336 101 1 0 0 0 0 0 0 0 0 0 0 0 0 0 0 0 646 14 22 5 1 0 0 4 1 1 1 0 0 0 0 0 0 9352 27 496 1 29 14 3 12 0 3 0 1 0 0 0 0 0 0 1 13 0 0 0 0 0 0 0 0 0 0 0 0 0 0 0 0 1 10 1 0 0 0 0 0 0 0 0 0 0 0 0 0 0 0 2 7 0 0 0 0 0 0 0 0 0 0 0 0 0 0 0 0 2 3 0 0 0 0 0 0 0 0 0 0 0 0 0 0 0 0 0 1 0 0 0 0 0 0 0 0 0 1 0 0 0 0 0 0 0 0 0 0 0 0 0 0 0 0 0 0 0 0 0 0 0 0 0 ] miss_latency_ATOMIC: [binsize: 4 max: 427 count: 1617 average: 103.586 | standard deviation: 95.0209 | 0 697 0 0 0 0 0 0 0 0 0 0 0 0 0 0 94 3 0 0 0 0 0 0 0 0 0 0 0 0 0 0 0 0 187 2 8 1 0 1 0 1 0 2 0 0 0 0 0 0 0 551 6 48 1 0 0 0 0 0 0 0 0 0 0 0 0 0 0 0 5 1 1 0 0 0 0 0 0 0 0 0 0 0 0 0 0 0 4 1 0 0 0 0 0 0 0 0 0 0 0 0 0 0 0 0 3 0 0 0 0 0 0 0 0 0 0 0 0 0 0 0 0 0 0 0 0 0 0 0 0 0 0 0 0 0 0 0 0 0 0 0 0 0 0 0 0 0 0 0 0 0 0 0 0 0 0 0 0 0 0 0 0 0 0 0 0 0 0 0 0 0 0 0 0 0 0 ] miss_latency_IFETCH: [binsize: 2 max: 249 count: 21542 average: 70.3483 | standard deviation: 95.4592 | 0 0 14519 0 0 0 0 0 0 0 0 0 0 0 0 0 0 0 0 0 0 0 0 0 0 0 0 0 0 0 0 0 0 0 0 0 0 0 0 0 0 0 0 0 0 0 0 0 0 0 0 0 0 0 0 0 0 0 0 0 0 0 0 0 0 0 0 0 4 12 0 0 0 0 0 0 0 0 0 0 0 0 0 0 0 0 0 0 0 0 0 0 0 0 0 0 0 0 0 0 0 0 0 5863 26 22 846 4 4 0 79 2 0 71 1 0 0 51 1 0 0 24 0 0 13 ] miss_latency_NULL: [binsize: 4 max: 610 count: 50274 average: 113.155 | standard deviation: 97.9074 | 0 21762 0 0 0 0 0 0 0 0 0 0 0 0 0 0 430 104 1 0 0 0 0 0 0 0 0 0 0 0 0 0 0 0 2383 63 332 164 131 238 23 246 5 150 2 23 8 0 0 0 1 21736 100 1846 10 164 119 10 94 2 41 0 15 0 0 0 0 0 0 1 27 1 1 2 0 0 0 0 0 0 0 0 0 0 0 0 0 1 15 2 0 0 0 0 0 0 0 0 0 0 0 0 0 0 0 2 11 1 0 0 0 0 0 0 0 0 0 0 0 0 0 0 0 2 3 0 0 0 0 0 0 0 0 0 0 0 0 0 0 0 0 0 1 0 0 0 0 0 0 0 0 0 1 0 0 0 0 0 0 0 0 0 0 0 0 0 0 0 0 0 0 0 0 0 0 0 0 0 ] miss_latency_L2Miss: [binsize: 1 max: 0 count: 0 average: NaN |standard deviation: NaN | 0 ] All Non-Zero Cycle SW Prefetch Requests ------------------------------------ g_MEMORY_SIZE_BITS: 30 g_DATA_BLOCK_BITS: 6 g_PAGE_SIZE_BITS: 12 g_NUM_PROCESSORS_BITS: 3 g_PROCS_PER_CHIP_BITS: 0 g_NUM_L2_BANKS_BITS: 3 g_NUM_L2_BANKS_PER_CHIP_BITS: 0 g_NUM_L2_BANKS_PER_CHIP: 1 g_NUM_MEMORIES_BITS: 3 g_NUM_MEMORIES_PER_CHIP: 1 g_MEMORY_MODULE_BITS: 21 g_MEMORY_MODULE_BLOCKS: 2097152 MAP_L2BANKS_TO_LOWEST_BITS: false DIRECTORY_CACHE_LATENCY: 6 NULL_LATENCY: 1 ISSUE_LATENCY: 2 CACHE_RESPONSE_LATENCY_MINUS_1: 11 MEMORY_LATENCY: 80 DIRECTORY_LATENCY: 80 NETWORK_LINK_LATENCY: 14 COPY_HEAD_LATENCY: 4 ON_CHIP_LINK_LATENCY: 1 RECYCLE_LATENCY: 10 L2_RECYCLE_LATENCY: 5 TIMER_LATENCY: 10000 L1_BANK_LATENCY_MINUS_1: 2 L2_BANK_LATENCY_MINUS_2: 4 TBE_RESPONSE_LATENCY: 1 PERIODIC_TIMER_WAKEUPS: true L2_cache_misses_per_instruction: 7.60358e-05 L2_cache_instructions_per_misses: 13151.7 L2_cache_request_type_LD: 33.165% L2_cache_request_type_ST: 38.9766% L2_cache_request_type_ATOMIC: 3.22671% L2_cache_request_type_IFETCH: 24.6317% L2_cache_access_mode_type_SupervisorMode: 24839 87.1177% L2_cache_access_mode_type_UserMode: 3673 12.8823% L2_cache_request_size: [binsize: log2 max: 64 count: 28512 average: 24.927 | standard deviation: 28.0464 | 0 1357 577 11484 5424 0 0 9670 ] Total_misses: 28512 total_misses: 28512 [ 2098 797 849 608 635 3632 18105 1788 ] user_misses: 3673 [ 0 0 0 0 0 234 3103 336 ] supervisor_misses: 24839 [ 2098 797 849 608 635 3398 15002 1452 ] instruction_executed: 374981341 [ 52017683 51976805 51917161 52160663 52135482 48815032 15010842 50947673 ] cycles_per_instruction: 0.562716 [ 0.507058 0.507457 0.50804 0.505668 0.505913 0.540325 1.75713 0.517708 ] misses_per_thousand_instructions: 0.0760358 [ 0.0403324 0.0153338 0.016353 0.0116563 0.0121798 0.0744033 1.20613 0.0350948 ] transactions_started: 0 [ 0 0 0 0 0 0 0 0 ] transactions_ended: 0 [ 0 0 0 0 0 0 0 0 ] instructions_per_transaction: 0 [ 0 0 0 0 0 0 0 0 ] cycles_per_transaction: 0 [ 0 0 0 0 0 0 0 0 ] links_utilized_percent_switch_16: 0.0516348 links_utilized_percent_switch_16_link_0: 0.0516348 bw: 10000 base_latency: 14 outgoing_messages_switch_16_link_0_Control: 4352 34816 [ 4352 0 0 0 ] base_latency: 14 outgoing_messages_switch_16_link_0_Data: 1408 101376 [ 0 1408 0 0 ] base_latency: 14 switch_17_inlinks: 4 switch_17_outlinks: 1 links_utilized_percent_switch_17: 0.139776 links_utilized_percent_switch_17_link_0: 0.139776 bw: 10000 base_latency: 14 outgoing_messages_switch_17_link_0_Control: 24160 193280 [ 24160 0 0 0 ] base_latency: 14 outgoing_messages_switch_17_link_0_Data: 2436 175392 [ 0 2436 0 0 ] base_latency: 14 switch_18_inlinks: 4 switch_18_outlinks: 1 links_utilized_percent_switch_18: 0.328062 links_utilized_percent_switch_18_link_0: 0.328062 bw: 10000 base_latency: 14 outgoing_messages_switch_18_link_0_Data: 12018 865296 [ 0 12018 0 0 ] base_latency: 14 switch_19_inlinks: 4 switch_19_outlinks: 1 links_utilized_percent_switch_19: 0.329481 links_utilized_percent_switch_19_link_0: 0.329481 bw: 10000 base_latency: 14 outgoing_messages_switch_19_link_0_Data: 12070 869040 [ 0 12070 0 0 ] base_latency: 14 switch_20_inlinks: 4 outgoing_messages_switch_3_link_0_Data: 138 9936 [ 0 138 0 0 ] base_latency: 14 switch_4_inlinks: 1 switch_4_outlinks: 1 links_utilized_percent_switch_4: 0.00451926 links_utilized_percent_switch_4_link_0: 0.00451926 bw: 10000 base_latency: 14 outgoing_messages_switch_4_link_0_Control: 635 5080 [ 635 0 0 0 ] base_latency: 14 outgoing_messages_switch_4_link_0_Data: 95 6840 [ 0 95 0 0 ] base_latency: 14 switch_5_inlinks: 1 switch_5_outlinks: 1 links_utilized_percent_switch_5: 0.0330998 links_utilized_percent_switch_5_link_0: 0.0330998 bw: 10000 base_latency: 14 outgoing_messages_switch_5_link_0_Control: 3632 29056 [ 3632 0 0 0 ] base_latency: 14 outgoing_messages_switch_5_link_0_Data: 809 58248 [ 0 809 0 0 ] base_latency: 14 switch_6_inlinks: 1 switch_6_outlinks: 1 links_utilized_percent_switch_6: 0.0840127 links_utilized_percent_switch_6_link_0: 0.0840127 bw: 10000 base_latency: 14 outgoing_messages_switch_6_link_0_Control: 18105 144840 [ 18105 0 0 0 ] base_latency: 14 outgoing_messages_switch_6_link_0_Data: 1066 76752 [ 0 1066 0 0 ] base_latency: 14 switch_7_inlinks: 1 switch_7_outlinks: 1 links_utilized_percent_switch_7: 0.0181438 links_utilized_percent_switch_7_link_0: 0.0181438 bw: 10000 base_latency: 14 L2_Replacement 0 Own_GETS 9456 Own_GET_INSTR 7023 Own_GETX 12033 Own_PUTX 0 Other_GETS 66192 Other_GET_INSTR 49161 Other_GETX 84231 Other_PUTX 0 Data 27977 - Transitions - NP Load 7057 NP Ifetch 7021 NP Store 9426 NP Other_GETS 50429 NP Other_GET_INSTR 43420 NP Other_GETX 79638 NP Other_PUTX 0 <-- I Load 2399 I Ifetch 2 I Store 140 I L1_to_L2 189 I L2_to_L1D 139 I L2_to_L1I 1 I L2_Replacement 0 <-- I Other_GETS 3181 I Other_GET_INSTR 0 <-- M Store 1955 M L1_to_L2 12532 M L2_to_L1D 3888 M L2_to_L1I 260 M L2_Replacement 0 <-- M Other_GETS 1310 M Other_GET_INSTR 16 M Other_GETX 260 M Other_PUTX 0 <-- IS_AD Load 0 <-- IS_AD Ifetch 0 <-- IS_AD Store 0 <-- IS_AD L1_to_L2 0 <-- IS_AD L2_to_L1D 0 <-- IS_AD L2_to_L1I 0 <-- IS_AD L2_Replacement 0 <-- IS_AD Own_GETS 9456 IS_AD Own_GET_INSTR 7023 IS_AD Other_GETS 3376 IS_AD Other_GET_INSTR 411 IS_AD Other_GETX 111 IS_AD Other_PUTX 0 <-- IS_AD Data 0 <-- IM_AD Load 0 <-- IM_AD Ifetch 0 <-- IM_AD Store 0 <-- IM_AD L1_to_L2 0 <-- I Other_GETX 1024 I Other_PUTX 0 <-- S Load 3180 S Ifetch 14205 S Store 1930 S L1_to_L2 24732 S L2_to_L1D 3208 S L2_to_L1I 14205 S L2_Replacement 0 <-- S Other_GETS 2833 S Other_GET_INSTR 4903 S Other_GETX 1965 S Other_PUTX 0 <-- O Load 175 O Ifetch 54 O Store 537 O L1_to_L2 319 O L2_to_L1D 207 O L2_to_L1I 54 O L2_Replacement 0 <-- O Other_GETS 1358 O Other_GET_INSTR 0 <-- O Other_GETX 635 O Other_PUTX 0 <-- M Load 1933 M Ifetch 260 switch_0_outlinks: 1 links_utilized_percent_switch_0: 0.0302487 links_utilized_percent_switch_0_link_0: 0.0302487 bw: 10000 base_latency: 14 outgoing_messages_switch_0_link_0_Control: 2098 16784 [ 2098 0 0 0 ] base_latency: 14 outgoing_messages_switch_0_link_0_Data: 875 63000 [ 0 875 0 0 ] base_latency: 14 switch_1_inlinks: 1 switch_1_outlinks: 1 links_utilized_percent_switch_1: 0.00678496 links_utilized_percent_switch_1_link_0: 0.00678496 bw: 10000 base_latency: 14 outgoing_messages_switch_1_link_0_Control: 797 6376 [ 797 0 0 0 ] base_latency: 14 outgoing_messages_switch_1_link_0_Data: 160 11520 [ 0 160 0 0 ] base_latency: 14 switch_2_inlinks: 1 switch_2_outlinks: 1 links_utilized_percent_switch_2: 0.00898999 links_utilized_percent_switch_2_link_0: 0.00898999 bw: 10000 base_latency: 14 outgoing_messages_switch_2_link_0_Control: 849 6792 [ 849 0 0 0 ] base_latency: 14 outgoing_messages_switch_2_link_0_Data: 235 16920 [ 0 235 0 0 ] base_latency: 14 switch_3_inlinks: 1 switch_3_outlinks: 1 links_utilized_percent_switch_3: 0.00561116 links_utilized_percent_switch_3_link_0: 0.00561116 bw: 10000 base_latency: 14 outgoing_messages_switch_3_link_0_Control: 608 4864 [ 608 0 0 0 ] base_latency: 14 --------------------- network: SIMPLE_NETWORK virtual_net_0: active, ordered virtual_net_1: active, unordered virtual_net_2: inactive virtual_net_3: inactive Simics ruby multiplier: 2 Simics stall time: 2000000000 Chip Config ----------- TBEs_per_TBETable: 128 Cache config: L1Cache_0_L1I cache_associativity: 4 num_cache_sets_bits: 8 num_cache_sets: 256 cache_set_size_bytes: 16384 cache_set_size_Kbytes: 16 cache_set_size_Mbytes: 0.015625 cache_size_bytes: 65536 cache_size_Kbytes: 64 cache_size_Mbytes: 0.0625 Cache config: L1Cache_0_L1D cache_associativity: 4 num_cache_sets_bits: 8 num_cache_sets: 256 cache_set_size_bytes: 16384 outgoing_messages_switch_23_link_2_Control: 3290 26320 [ 3290 0 0 0 ] base_latency: 14 outgoing_messages_switch_23_link_3_Control: 3792 30336 [ 3792 0 0 0 ] base_latency: 14 switch_24_inlinks: 1 switch_24_outlinks: 4 links_utilized_percent_switch_24: 0.0110297 links_utilized_percent_switch_24_link_0: 0.011007 bw: 10000 base_latency: 14 links_utilized_percent_switch_24_link_1: 0.0106885 bw: 10000 base_latency: 14 links_utilized_percent_switch_24_link_2: 0.011556 bw: 10000 base_latency: 14 links_utilized_percent_switch_24_link_3: 0.0108675 bw: 10000 base_latency: 14 outgoing_messages_switch_24_link_0_Control: 3629 29032 [ 3629 0 0 0 ] base_latency: 14 outgoing_messages_switch_24_link_1_Control: 3524 28192 [ 3524 0 0 0 ] base_latency: 14 outgoing_messages_switch_24_link_2_Control: 3810 30480 [ 3810 0 0 0 ] base_latency: 14 outgoing_messages_switch_24_link_3_Control: 3583 28664 [ 3583 0 0 0 ] base_latency: 14 Simics Driver Transaction Stats ---------------------------------- Insn requests: 374980900 Data requests: 88705149 Memory mapped IO register accesses: 58 Device initiated accesses: 0 Other initiated accesses: 0 Atomic load accesses: 5066 Exceptions: 5871 Non stallable accesses: 17230 Prefetches: 0 Cache Flush: 737 switch_20_outlinks: 4 links_utilized_percent_switch_20: 0.255573 links_utilized_percent_switch_20_link_0: 0.199682 bw: 10000 base_latency: 14 links_utilized_percent_switch_20_link_1: 0.736133 bw: 10000 base_latency: 14 links_utilized_percent_switch_20_link_2: 0.0423597 bw: 10000 base_latency: 14 links_utilized_percent_switch_20_link_3: 0.0441189 bw: 10000 base_latency: 14 outgoing_messages_switch_20_link_0_Control: 28512 228096 [ 28512 0 0 0 ] base_latency: 14 outgoing_messages_switch_20_link_0_Data: 4147 298584 [ 0 4147 0 0 ] base_latency: 14 outgoing_messages_switch_20_link_1_Control: 28512 228096 [ 28512 0 0 0 ] base_latency: 14 outgoing_messages_switch_20_link_1_Data: 23799 1713528 [ 0 23799 0 0 ] base_latency: 14 outgoing_messages_switch_20_link_2_Control: 13966 111728 [ 13966 0 0 0 ] base_latency: 14 outgoing_messages_switch_20_link_3_Control: 14546 116368 [ 14546 0 0 0 ] base_latency: 14 switch_21_inlinks: 1 switch_21_outlinks: 4 links_utilized_percent_switch_21: 0.114848 links_utilized_percent_switch_21_link_0: 0.141265 bw: 10000 base_latency: 14 links_utilized_percent_switch_21_link_1: 0.107252 bw: 10000 base_latency: 14 links_utilized_percent_switch_21_link_2: 0.108617 bw: 10000 base_latency: 14 links_utilized_percent_switch_21_link_3: 0.102257 bw: 10000 base_latency: 14 outgoing_messages_switch_21_link_0_Control: 28512 228096 [ 28512 0 0 0 ] base_latency: 14 outgoing_messages_switch_21_link_0_Data: 2007 144504 [ 0 2007 0 0 ] base_latency: 14 outgoing_messages_switch_21_link_1_Control: 28512 228096 [ 28512 0 0 0 ] base_latency: 14 outgoing_messages_switch_21_link_1_Data: 761 54792 [ 0 761 0 0 ] base_latency: 14 outgoing_messages_switch_21_link_2_Control: 28512 228096 [ 28512 0 0 0 ] base_latency: 14 outgoing_messages_switch_21_link_2_Data: 811 58392 [ 0 811 0 0 ] base_latency: 14 outgoing_messages_switch_21_link_3_Control: 28512 228096 [ 28512 0 0 0 ] base_latency: 14 NaN | 0 ] virtual_network_2_delay_cycles: [binsize: 1 max: 0 count: 0 average: NaN |standard deviation: NaN | 0 ] virtual_network_3_delay_cycles: [binsize: 1 max: 0 count: 0 average: NaN |standard deviation: NaN | 0 ] Resource Usage -------------- page_size: 4096 user_time: 8259 system_time: 8 page_reclaims: 71016 page_faults: 14 swaps: 0 block_inputs: 0 block_outputs: 0 MessageBuffer: [Chip 0 0, L1Cache, mandatoryQueue_in] stats - msgs:2604 full:0 MessageBuffer: [Chip 1 0, L1Cache, mandatoryQueue_in] stats - msgs:797 full:0 MessageBuffer: [Chip 2 0, L1Cache, mandatoryQueue_in] stats - msgs:855 full:0 MessageBuffer: [Chip 3 0, L1Cache, mandatoryQueue_in] stats - msgs:608 full:0 MessageBuffer: [Chip 4 0, L1Cache, mandatoryQueue_in] stats - msgs:635 full:0 MessageBuffer: [Chip 5 0, L1Cache, mandatoryQueue_in] stats - msgs:4010 full:0 MessageBuffer: [Chip 6 0, L1Cache, mandatoryQueue_in] stats - msgs:38932 full:0 MessageBuffer: [Chip 7 0, L1Cache, mandatoryQueue_in] stats - msgs:1833 full:0 Network Stats ------------- switch_0_inlinks: 1
Weaknesses • Requires a highly capable host Machine • No modeling of Bus Based Architecture • No simple way to disable Performance Statistics
Conclusion • Complexity of Cache Coherency Protocols • Excellent Interface for testing new Protocols • GEMS is useful if left running for days or weeks simulating a real operating system environment • GEMS is not useful for a quick contrast of coherency protocols.