Download
1 / 13
130 likes | 281 Views
Illinois Greenhouse Gas Emissions Inventory and Projections: 1990-2020. Meeting of the Illinois Climate Change Advisory Group 300 West Adams St., 2nd Floor, Chicago, IL February 22, 2007. Governor Rod R. Blagojevich Climate Change Advisory Group. Topics to Cover.

E N D
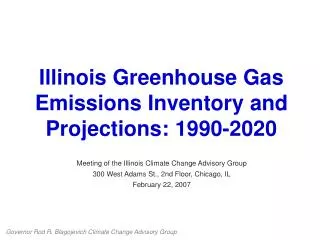
Illinois Greenhouse Gas Emissions Inventory and Projections: 1990-2020 Meeting of the Illinois Climate Change Advisory Group 300 West Adams St., 2nd Floor, Chicago, IL February 22, 2007 Governor Rod R. Blagojevich Climate Change Advisory Group
Topics to Cover • Data Sources and the Climate Analysis Indicators Tool (CAIT) • Greenhouse Gases in Illinois and the U.S. • Illinois Greenhouse Gas Projections to 2020 • Discussion
CAIT overview: • State-level data available for 6 Kyoto gases across the economy • CAIT based on EPA’s Emissions Inventory Improvement Program (EIIP) Tools • Does not include int’l bunker fuels and land use change and forestry CAIT is available free at: http://cait.wri.org
Federal data, tools and state proxies used Data uncertainties have only a small effect on aggregate state emissions
Topics to Cover • Data Sources and the Climate Analysis Indicators Tool (CAIT) • Greenhouse Gases in Illinois and the U.S. • Illinois Greenhouse Gas Projections to 2020 • Discussion
Fugitive Commercial Emissions CH4 F-Gases 5% 1% 2% 4% N2O Industrial 9% Electricity Generation Processes 30% 5% Industrial CO2 14% 85% IL is a big emitter; electricity & transport lead • Total Illinois GHG emissions 2003: 274.7 million metric tonnes • 5th largest GHG emitting state in the U.S. • Roughly equal to total emissions of the Netherlands IL GHGs by Gas (2003) IL GHGs by Sector (2003) Waste 2% Agriculture 9% Residential 10% Transportation 24%
Unusually Warm Winter National Recessions Emissions growth has varied Illinois GHG Emission Trends by Sector 1990-2003
Topics to Cover • Data Sources and the Climate Analysis Indicators Tool (CAIT) • Greenhouse Gases in Illinois and the U.S. • Illinois Greenhouse Gas Projections to 2020 • Discussion
Projections methodology: • Transportation, Residential, Commercial and Industrial sector growth rates are based on EIA projections for energy use in the East North Central region (IL, IN, MI, OH and WI) • Electric generation and non-energy sector growth rates are derived from historic trends • Illinois total GHG emissions are projected to increase at an annual rate of 1.00%
Projected Actual High Best Guess Best Guess:37.2% above 1990 levels = 88 MtCO2e Low IL GHGs projected to be 326 MtCO2e by 2020 Illinois actual and projected GHG Emissions 1990-2020
26% below best guess case in 2020 1990 levels EIP could cut 22.9 million tonnes from projected emissions by 2020 Illinois actual and projected GHG Emissions with Energy Independence Plan measures 1990-2020 Projected Actual
Discussion Questions and Comments