Download
1 / 16
160 likes | 244 Views
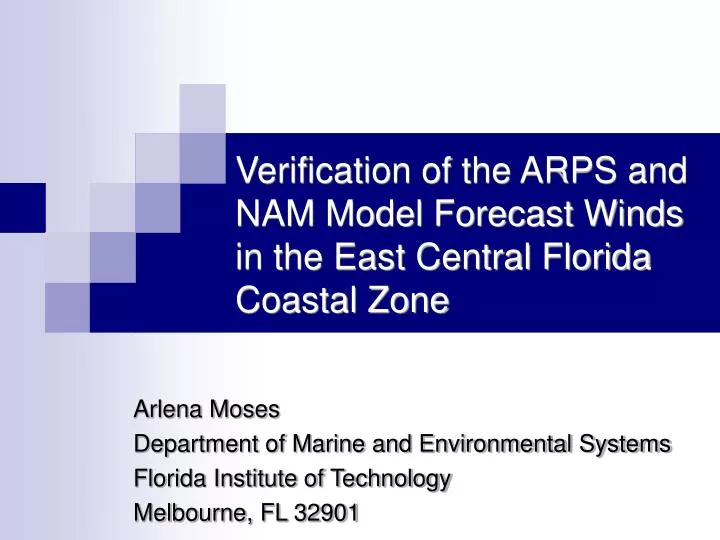
Verification of the ARPS and NAM Model Forecast Winds in the East Central Florida Coastal Zone. Arlena Moses Department of Marine and Environmental Systems Florida Institute of Technology Melbourne, FL 32901. Overview. Introduction Analysis Methods Model Performance

E N D
Verification of the ARPS and NAM Model Forecast Winds in the East Central Florida Coastal Zone Arlena Moses Department of Marine and Environmental Systems Florida Institute of Technology Melbourne, FL 32901
Overview • Introduction • Analysis Methods • Model Performance • Performance During Tropical Storm Arlene • Summary
Why are We Interested in Wind Forecasts? • Winds direction and speed can affect • Atmospheric stability • Convective Development (or lack thereof) • Commercial and Recreational Boating Interests • Dispersion of smoke and toxic substances • Rocket and Shuttle Launch Conditions • Inaccurate wind forecasts can cause feedback in other portions of the forecast
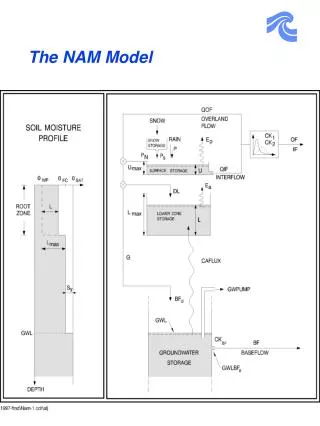
Why Choose These Models? • Wet season weather is often dominated by local circulations • WFO Melbourne provides gridded forecasts at 5km resolution • These models provide good resolution of local and mesoscale features Table 1: Model Resolutions
Methods • The study was conducted 1-30 Jun 2005 • The ‘nighttime’ hours of 03Z to 12Z (11pm-8am EDT) were considered for each day • To evaluate development of nighttime land breezes • To correspond with the 3Z ARPS run • Seven parameters evaluated • Five sites within coastal zone of the WFO Melbourne CWA Table 2: Evaluated Forecast Parameters
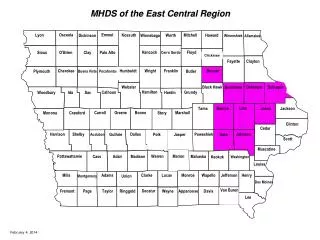
(009) Figure 1: Sites evaluated in the study (Pink Dots) within the NWS Melbourne CWA (shaded in gold). Other cities provided for reference
Model Performance Table 3: Averages for June 2005
Model Performance • The NAM12 performed better overall in forecasting wind direction and surface temperature • ARPS performed better in direction at Buoy 41009 • The ARPS provided more accurate forecasts for wind speeds at all sites • Both models show a tendency to forecast higher winds than observed • Most noticeable at Buoy 41009 and TTS • Possibly due to the model handling of nighttime surface boundary layer over water
TS Arlene – 10 June 2005 TS Arlene passed into the Gulf of Mexico and west of the Florida peninsula between 10 and 11 June Figure 2: 10 June 2005 12Z Surface Map http://www.hpc.noaa.gov
TS Arlene – 10 June 2005 • ARPS • No error in direction forecast at VRB • Forecasted winds tended more southerly than observed directions • Average difference at DAB was -25.00° • NAM12 • No error in direction forecasts at MLB • Least Accurate at DAB (-22.50°) • Speed most accurately forecasted at DAB (-1.50kts) and VRB (-1.75kts) • Both models least accurate speed forecasts at TTS and 009 • Forecast errors may be due to inaccurate forecasting of storm position
Figure 3: NAM12 and ARPS Forecast vs Observed Wind Direction on 10 June 2005 at DAB
Figure 4: ARPS NAM12 Forecast vs Observed Wind Speed on 10 June 2005 at TTS and 009
Summary and Recommendations • Wind direction and speed can have a variety of impact on weather and operations • The NAM12 performed better overall in wind direction and surface temperature, the ARPS in wind speeds • Tendency to forecast higher winds than observed • Forecast errors during Arlene possibly due to misplacement of storm • Longer time period/More hours needed for more comprehensive comparison
Acknowledgements A special thanks to the National Weather Service Office in Melbourne, Florida for data and assistance
References • Case, J.L. 2002: Final Report of Land-Breeze Forecasting. NASA Contractor CR-2002-211181, Kennedy Space Center, FL, 56 pp. • NOAA-National Weather Service. [http://www.noaa.gov]. Accessed 15 Jul 2005. • North American Surface Analysis. Hydrometeorological Prediction Center. [http://www.hpc.ncep.noaa.gov]. Accessed 15 Jul 2005. • Operational Models Matrix. Meteorology Education and Training. [http://meted.ucar.edu/nwp/pcu2/index.htm] Accessed 15 Jul 2005. • Real Time Operational and Analysis Network (ROMAN). [http://raws.wrh.noaa.gov/roman/]. Accessed 15 Jul 2005. • Tropical Weather Summary-June 2005. National Hurricane Center [http://www.nhc.noaa.gov]. Accessed 15 Jul 2005. • Weather Observation Station Record. National Climatic Data Center. [http://www.ncdc.noaa.gov]. Accessed 15 Jul 2005 • Xue, M., Droegemeier, K., Wong, V. "The Advanced Regional Prediction System and Real-time Storm-scale Weather Prediction." International Workshop on Limited-area and Variable Resolution Models. Beijing, China, October, 1995.
Questions? Next : Break