Download
1 / 11
280 likes | 769 Views
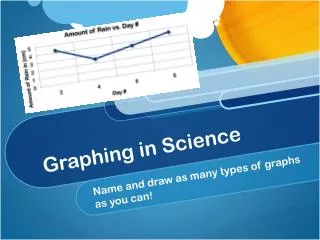
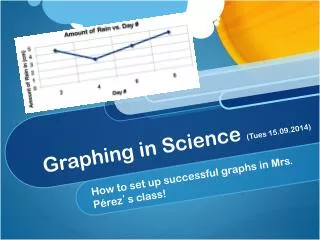
Graphing in Science. D-TAILS. D-TAILS is an acronym used to help you remember everything you need to create a successful graph. D -TAILS. Data covers 50% of the graph area and is accurately placed. NO!!!. YES!!!. D- T AILS. Title

E N D
D-TAILS D-TAILS is an acronym used to help you remember everything you need to create a successful graph.
D-TAILS • Data covers 50% of the graph area and is accurately placed. NO!!! YES!!!
D-TAILS Title Includes what the graph is about and both the manipulated and responding variables. Hours of Sleep vs. Quiz Scores
D-TAILS Axis Labels– manipulated variable is always on the x-axis and responding variable is always on the y-axis Hours of Sleep vs. Quiz Scores Quiz Scores Sleep
D-TAILS Interval Marks Consistent spacing and always start at zero! Hours of Sleep vs. Quiz Scores 100 75 Quiz Scores 50 25 0 0 1 2 3 4 5 6 7 8 Sleep
D-TAILS Label Units In ( ) after the axis label, include the proper units (if there are units) Hours of Sleep vs. Quiz Scores 100 75 Quiz Scores (%) 50 25 0 0 1 2 3 4 5 6 7 8 Sleep (hrs)
D-TAILS Scale Always go by an even scale. Ex: 1,2,3,4 NOT 1,2,4,8 Hours of Sleep vs. Quiz Scores 100 75 Quiz Scores (%) 50 25 0 0 1 2 3 4 5 6 7 8 Sleep (hrs)
Always draw a trend line (do NOT connect the dots) to show the mv/rv relationship.
After drawing the graph, write a data analysis statement: This graph shows that as mv increases, rv