Download
1 / 33
340 likes | 509 Views
EARTHQUAKE RECURRENCE Crucial for hazards, earthquake physics & tectonics (seismic versus aseismic deformation).

E N D
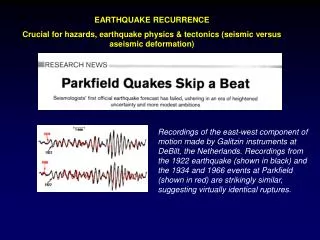
EARTHQUAKE RECURRENCE Crucial for hazards, earthquake physics & tectonics (seismic versus aseismic deformation) Recordings of the east-west component of motion made by Galitzin instruments at DeBilt, the Netherlands. Recordings from the 1922 earthquake (shown in black) and the 1934 and 1966 events at Parkfield (shown in red) are strikingly similar, suggesting virtually identical ruptures.
EARTHQUAKE FREQUENCY - MAGNITUDE LOG-LINEAR Gutenberg-Richter RELATION
CHALLENGE: INFER UNKNOWN RATE OF LARGEST EARTHQUAKES FROM RECORDED RATE OF SMALLER ONESUse standard log-linearGutenberg-Richter relationship Global Earthquakes Continental Intraplate Number per year Triep & Sykes, 1997 Stein & Wysession, 2003 Magnitude (Ms) Magnitude (Ms) With seismological data only, log-linear relation breaks down Largest earthquakes (M > 7-7.5) less frequent than expected, presumably due to fault finiteness (large event lengths >> width)
Romanowicz, 1992 Most earthquakes between solid lines with slope 1/3, showing M0 proportional to L3. However, strike-slip earthquakes (solid diamonds) have moments higher than expected for their fault lengths, because above a certain moment fault width reaches maximum, so fault grows only in length.
Total global seismic moment release dominated by few largest events Total moment for 1976-1998 ~1/3 that of giant 1960 Chilean earthquake
GUTENBERG-RICHTER RELATIONSHIP: INDIVIDUAL FAULTS Wasatch Basel, Switzerland instrumental data historical data Uncharacteristic Characteristic paleoseismic data paleoseismic data Meghraoui et al., 2001 Youngs & Coppersmith, 1985 Largest events deviate in either direction, often when different data mismatch When more frequent than expected termed characteristic earthquakes. Alternative are uncharacteristic earthquakes Could these differences - at least in some cases - be artifacts?
EARTHQUAKE RECURRENCE IS HIGHLY VARIABLE Sieh et al., 1989 Extend earthquake history with paleoseismology M>7 mean 132 yr s 105 yr Estimated probability in 30 yrs 7-51%
ESTIMATING EARTHQUAKE PROBABILITIES A game of chance, with unknown rules, and very little data from which to infer them
CHALLENGE: DON’T KNOW WHAT PROBABILITY DISTRIBUTION DESCRIBES EARTHQUAKE RECURRENCE TIMES
POISSON DISTRIBUTION TIME INDEPENDENT MODEL OF EARTHQUAKE PROBABILITY Used to describe rare events: include volcanic eruptions, radioactive decay, and number of Prussian soldiers killed by their horses
GAUSSIAN DISTRIBUTION TIME DEPENDENT MODEL OF EARTHQUAKE PROBABILITY Probability of large earthquake a time t after the past one is p(t, , ) Depends on average and variability of recurrence times, described by the mean and standard deviation p is probability that recurrence time for this earthquake will be t, given an assumed distribution of recurrence times.
CONDITIONAL PROBABILITY Use the fact that we know the next earthquake hasn’t already happened
SAN ANDREAS FAULT PALLETT CREEK SEGMENT Gaussian (time dependent) model Gaussian In 1983, estimate 9% probability by 2003, increases with time
SAN ANDREAS FAULT PALLETT CREEK SEGMENT Poisson (time independent) model Gaussian In 1983, estimate 10% probability by 2003, constant with time
SYNTHETIC EARTHQUAKE HISTORIES Gaussian model yields more periodic series; Poisson model yields clustering Which looks more like earthquake history?
SEISMIC GAP MODEL Long plate boundary like the San Andreas or an oceanic trench ruptures in segments Expect steady plate motion to cause earthquakes that fill in gaps that have not ruptured for a long time Gap exists when it has been long enough since the last major earthquake that time-dependent models predict earthquake probability much higher than expected from time-independent models Sounds sensible but seems not to work well, for unknown reasons GAP? NOTHING YET
EARTHQUAKE FORECASTS: EASY TO MAKE, HARD TO TEST Hard to prove right or wrong Because the estimates must be tested using data that were not used to derive them, hundreds or thousands of years (multiple recurrences) will be needed to assess how well various models predict large earthquakes on specific faults or fault segments. The first challenge is to show that a model predicts future earthquakes significantly better than the simple time-independent Poissonian model Given human impatience, attempts have been made to conduct alternative tests using smaller earthquakes or many faults over a short time interval. To date, results are not encouraging.
RECENT SEISMICITY MAY NOT REFLECT LONG-TERM PATTERN WELL Random seismicity simulation for fault along which probability of earthquake is uniform Apparent seismic gaps develop May take long time to fill compared to length of earthquake record Stein & Wysession, 2003
PARKFIELD, CALIFORNIA SEGMENT OF SAN ANDREAS Characterized by smaller earthquakes that occur more frequently and appear much more periodic than other segments. Earthquakes of M 5-6 occurred in 1857, 1881, 1901, 1922, 1934, and 1966. Average recurrence is 22 yr; linear fit made 1988 likely date of the next event. In 1985, predicted at 95% confidence level that the next earthquake would occur by 1993 Actually didn’t occur till 2004 (16 years late) Problems: Limitations of statistical approach in prediction (including omission of 1934 earthquake on the grounds that was premature and should have occurred in 1944) Unclear whether Parkfield shows such unusual quasi-periodicity because it differs from other parts of San Andreas (in which case predicting earthquakes there might not be that helpful for others), or results simply from the fact that given enough time & fault segments, random seismicity can yield apparent periodicity somewhere
GLOBAL TEST OF SEISMIC GAP HYPOTHESIS Gap map forecasting locations of major earthquakes did no better than random guessing. Many more large earthquakes occurred in areas identified as low risk than in presumed higher-risk gaps (reverse colors?) Result appears inconsistent with ideas of earthquake cycles and seismic gaps Within 10 years of prediction, 10 large events occurred in these areas. None were in high- or intermediate-risk areas; 5 were in low-risk areas. Kagan & Jackson, 1991
EARTHQUAKE PROBABILITY MAPS Hard to assess utility of such maps for many years Major uncertainties involved Perhaps only meaningful to quote probabilities in broad ranges, such as low (<10%), intermediate (10-90%), or high (>90%).
MITIGATING EARTHQUAKE RISK Useful to distinguish between hazards and risks for earthquakes or other natural disasters. Hazard is natural occurrence of earthquakes and the resulting ground motion and other effects. Risk is the danger the hazard poses to life and property. Hazard is unavoidable geological fact, risk is affected by human actions. Areas of high hazard can have low risk because few people live there, and areas of modest hazard can have high risk due to large populations and poor construction. Earthquake risks can be reduced by human actions, whereashazards cannot.
In US, earthquake risk is primarily to property, though there are deaths Property loss can be high: $20 billion damage from the Northridge earthquake Some other countries have much greater risk The most destructive earthquakes occur where large populations live near plate boundaries. Highest property losses occur in developed nations where more property is at risk Fatalities are highest in developing nations.
PROBABILISTIC SEISMIC HAZARD ASSESSMENT (PSHA) Seek to quantify risk in terms of maximum expected acceleration in some time period (2% or 10% in 50 yr, or once in 2500 or 500 yr) Maps made by assuming: Where and how often earthquakes will occur How large they will be How much ground motion they will produce Because these factors are not well understood, especially on slow moving boundaries or intraplate regions where large earthquakes are rare, hazard estimates have considerable uncertainties and it will be a long time before we know how well they’ve done “A game of chance of which we still don't know all the rules"
EARTHQUAKE-RESISTANT CONSTRUCTION REDUCES EARTHQUAKE RISKS 0.2 g Damage onset for modern buildings “Earthquakes don't kill people; buildings kill people."
10% EXCEEDENCE PROBABILITY (90% NON EXCEEDENCE) WITHIN 50 YEARS Jimenez, Giardini, Grünthal (2003)
SHORT RECORD OF SEISMICITY & HAZARD ESTIMATE Africa-Eurasia convergence rate varies smoothly NUVEL-1 Argus et al., 1989 Predicted hazard from historic seismicity is highly variable Likely overestimated near recent earthquakes, underestimated elsewhere More uniform hazard seems more plausible - or opposite if time dependence considered Map changes after major earthquakes GSHAP
SHORT RECORD OF SEISMICITY & HAZARD ESTIMATE Africa-Eurasia convergence rate varies smoothly NUVEL-1 Argus et al., 1989 Predicted hazard from historic seismicity is highly variable Likely overestimated near recent earthquakes, underestimated elsewhere More uniform hazardseems more plausible - or opposite if time dependence considered Map changes after major earthquakes 2003 2004 GSHAP 1998
EARTHQUAKE PREDICTION? Because little is known about the fundamental physics of faulting, many attempts to predict earthquakes searched for precursors, observable behavior that precedes earthquakes. To date, search has proved generally unsuccessful In one hypothesis, all earthquakes start off as tiny earthquakes, which happen frequently, but only a few cascade via random failure process into large earthquakes This hypothesis draws on ideas from nonlinear dynamics or chaos theory, in which small perturbations can grow to have unpredictable large consequences. These ideas were posed in terms of the possibility that the flap of a butterfly's wings in Brazil might set off a tornado in Texas, or in general that minuscule disturbances do not affect the overall frequency of storms but can modify when they occur If so, there is nothing special about those tiny earthquakes that happen to grow into large ones, the interval between large earthquakes is highly variable and no observable precursors should occur before them. Thus earthquake prediction is either impossible or nearly so. “It’s hard to predict earthquakes, especially before they happen”