Download
1 / 16
160 likes | 314 Views
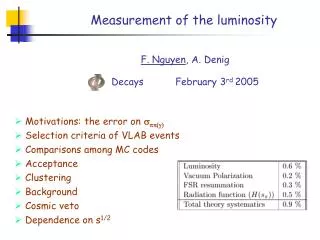
Measurement of the luminosity. F. Nguyen , A. Denig Decays February 3 rd 2005. Motivations: the error on s pp(g) Selection criteria of VLAB events Comparisons among MC codes Acceptance Clustering Background Cosmic veto Dependence on s 1/2. Large Angle Bhabha filter.

E N D
Measurement of the luminosity F. Nguyen, A. DenigDecays February 3rd 2005 • Motivations: the error on spp(g) • Selection criteria of VLAB events • Comparisons among MC codes • Acceptance • Clustering • Background • Cosmic veto • Dependence on s1/2
Large Angle Bhabha filter a= angle btw the 2 most energetic clusters nr. of events luminosity is given by Bhabha events divided for a s evaluated folding theory (QED rad. corrs.) with the detector simulation e+ e- e+ e- Data e+ e- g g TRIGGER GGL: ggseff 120 nb EmC Reconstruction LAB: e+e-seff 800 nb FILFO
2 tracks with: 1)r < 7.5 cm, |z| < 15 cm 2) p > 400 MeV 3) opposite curvature and the EMC cuts are tightened: 4)55o< q1,2 < 125o 5) z< 9o Very Large Angle Bhabha requirements 2 clusters with: 1)300 MeV < E < 800 MeV 2)45o< q1,2 < 135o 3) z= |q1 + q2 - 180o| < 10o 4) cos a > - 0.975 LAB filter: mainly EMC cuts, except for Nhits> 50 VLAB selection (after LAB): using DC to clean the sample e+ e- g
a set of 1 loop diagrams The effective cross section: comparisons BHAGENF: 1)complete 1 loop calculations 2)infrared and hard g corrections 3) the f exchange diagram BHAGENF: seff = ( 430.7 ± 0.3stat ) nb both groups of authors claim 0.5% BABAYAGA: 1)multiphoton emission parameterized by structure functions D(x,Q2), folding the Born cross section s0, each e±can emit up to 4 photons 2)the f exchange diagram BABAYAGA: seff = ( 431.0 ± 0.3stat ) nb
BHAGENF (460.8 0.1stat) nb BABAYAGA (459.4 0.1stat) nb BHWIDE (456.2 0.1stat) nb MCGPJ (455.3 0.1stat) nb 0.3 % 0.7 % 0.1 % The effective cross section: comparisons 1) only comparing pure QED corrections (f exchange and vacuum polarization are switched off) from “stand alone” evaluations: 2) the correct running of aem(s) is completely equivalent to the explicit f exchange diagram: s (wrong Dahad(s) with f) = 471.97 ± 0.11 nb s (correct Dahad(s) no f) = 471.63 ± 0.11 nb
Momentum and z comparisons • - MC • data • perfect agreement in the acollinearity distributions • the agreement near p ~ 400 MeV is • very good, a difference at large • p tail is negligible
Polar angle studies • global agreement is very good but the cut occurs in a steep region of the distributions estimate of border mismatches • after normalizing MC to make it coincide with data in the region 65o < q < 115o, we estimate as a systematic error: • - MC • data ~ 0.2%
Clustering efficiency: the problem definition of the control sample: 1)1 vtx in |r| < 5 cm with exactly 2 tracks 2)rLH > 180 cm for both 3) 1017.5 MeV < Me+e- < 1021.5 MeV 4) mtrk< 90 MeV among these events we look for 2 clusters with: 1)|rLH - rclu| < 40 cm for both 2)|tclu1 - tclu2| < 4 ns 3) Eclu > 300 MeV for both a difference of 0.3% btw data and MC
Ecl(MeV) xcl(cm) ycl(cm) Tcl(ns) A possible explanation e.g. take 3 rejected events because only 1 cluster has Ecl > 300 MeV a failure in the clustering procedure, due to wrong time information: a parent Bhabha cluster is splitted in 2 fragments, none surviving the cut at 300 MeV the effect is stable in time: a correction of 0.15%, leads to a relative difference data-MC of 0.1%
DATA events/3 MeV A0 A1 MC events/3 MeV Background estimate (I) other than Bhabha, there are events with mtrk ~ 136 MeV, e+e- p+ p- around mtrk ~ [100,170] MeV the exponential is subtracted from data
Background estimate (II) a second method consists in using the particle discriminator e/p, requiring that at least one track to be identified as a pion in the range mtrk > 100 MeV a weighted average of background content of 0.55% and a systematic error of 0.10% are estimated
Correction for the loss of vetoed events in rejecting cosmic events, only 1/5 of events withE > 30 MeVin the outer plane of the calorimeter are acquired (2001 conditions), after filtering a run with SELCOS and running the VLAB selection, a fraction of events survives this fraction is really stable in different runs: ~ 0.1% lost the correction to be applied because of VLAB events lost at the trigger level is 4*0.1%
Dependence on sqrt(s) run by run since the cross section is evaluated at the nominal value of s1/2= 1019.5 MeV some checks are performed to see how much L changes according to the measured s1/2 = Me+e- DL/L = -Ds/s is parameterized as a function of s1/2, from Monte Carlo:
List of corrections and systematics putting all together: 0.5 % (theory) 0.3 % (experiment) = 0.6 % (total error) 1+d(due tos1/2) L = (141.0 0.8) pb-1
Energy calibration studies in looking at the 1st plot I thought about a correction to compensate the mismatch at high Eclu values, but then there comes the 2nd plot…, something to refine in a run by run approach RUN 19199 • - MC • data RUN 19961 RUN 20419
Conclusions and outlook • in the measurement of the luminosity, the major source of uncertainty is from theory • the Pavia theory group has worked at an improved version of Babayaga • EURIDICE is a great opprtunity in triggering theorists to improve their calculations • to do (short term): • release a paper (a KLOE Note) with the details of the measurement • understand BHWIDE and Novosibirsk generators (not that trivial) • to do (long term): • analysis of the 2002 runs • measurement of L with gg, theorists claim 1% precision, but if we show them how clever are our measurements, we can motivate them to do better…