Download
1 / 16
160 likes | 273 Views
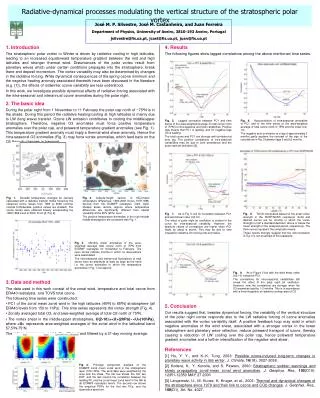
The dynamical signal in stratospheric temperatures from satellites. Changes and interannual variability (1979-2005). Paul J Young 1,2 , S Solomon 1 , D W J Thompson 3 , K H Rosenlof 1 , J-F Lamarque 1,2,4 , S C Sherwood 5 , Q Fu 6.

E N D
The dynamical signal in stratospheric temperatures from satellites Changes and interannual variability (1979-2005) Paul J Young1,2, S Solomon1, D W J Thompson3, K H Rosenlof1, J-F Lamarque1,2,4, S C Sherwood5, Q Fu6 (1) NOAA-ESRL, (2) CIRES-CU, (3) CSU Fort Collins, (4) NCAR, (5) U. NSW, Aus. (6) U. Washington Thanks to Craig Long and Roger Lin (NOAA - data); Bill Randel & Fei Wu (NCAR - data); Eric Ray, Bob Portmann, Sean Davis (NOAA - discussions)
Outline • Dynamical(Brewer-Dobson) temperature signal • The MSU/SSU temperature data • Horizontal patterns and interannual variability from Brewer-Dobsoncirculation • Long-term changes and the B-D circulation • Summary
COOLS HEATS Opposite-sense anomalies from stronger/weaker than average How do we get a dynamical temperature signal? Holton et al. 1995
Annual temperature cycle - Asymmetric wave driving = maximum wave driving (NH winter) (> 30°S/N) Ann cycle in extratropics (50%)… …balanced in tropics (50%) (30°S – 30°N) MSU T4 analysis from Yulaeva et al. 1994
Temperature data: MSU and SSU Microwave/Stratospheric sounding units Monthly/zonal mean anomalies, 1979-2005 Tropical tropopause Polar tropopause Randel et al. 2009
Horizontal patterns and interannual variability (De-trended data)
Winter correlations: Spider on the mirror High lats (>50N) and tropics High lats (>50S) and tropics NH, DJF SH, JJA SSU 27 SSU 26 SSU 25 MSU T4 1979 2005 1979 2005 Individual signals of SH 2002 winter, ENSO, others….? Young et al. in prep
Out-of-phase in hemispheric winter (B-DC signal) In-phase in NH summer (weak in SH summer) Tropics-S/N Pole correlations by month Local correlation with… > 60° N > 60° S SSU 27 SSU 26 Altitude SSU 25 MSU T4 Young et al. in prep
Brewer-Dobson circulation signals 1979-2005 See also Fu et al. (in review) for MSU discussion
? ? = B-DC strengthening? = B-DC weakening? Tropical/extratropical linear trends, 1979-2005 SSU 27 Changes in Tropics and extratropics balance adiabatic process SSU 26 Altitude SSU 25 MSU T4 April May Young et al. in prep
B-DC seasonality change / weakening B-DC strengthening B-DC strengthening Ozone-related cooling SSU 27 SSU 26 Altitude SSU 25 MSU T4 Young et al. in prep
Consistency with radiosonde trend Young et al. in prep
Summary • Wintertime B-D signal clear through the vertical • “Seasonal memory” in NH summer? (model?) • Satellites/radiosondes & adiabatic arguments change in strength/seasonality of B-DC over last ~30 years • Evidence for long term tendency? Still looking at decadal patterns, but appears winter strengthening is robust
Summer correlations: “seasonal memory”? Temperature data Ozone data Subtract F10.7cm regression
Summer correlations: “seasonal memory”? Temperature data Ozone data High lat-tropical T correlation from ozone? O3 anomalies persist through, e.g., NOy transport (Tegtmeier et al. 2008) Subtract F10.7cm regression