1 / 6

Quantifying Actin Bundling by HsACTN4 and SpAin1

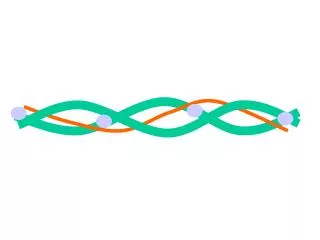
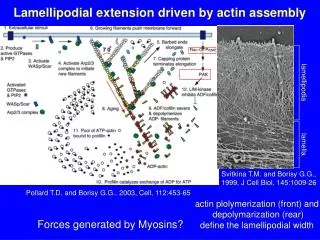
This study examines actin bundling by HsACTN4 and SpAin1 using colored filaments. The results show varying bundling levels at different concentrations of the proteins involved.

Download Presentation

Quantifying Actin Bundling by HsACTN4 and SpAin1

An Image/Link below is provided (as is) to download presentation Download Policy: Content on the Website is provided to you AS IS for your information and personal use and may not be sold / licensed / shared on other websites without getting consent from its author. Content is provided to you AS IS for your information and personal use only. Download presentation by click this link. While downloading, if for some reason you are not able to download a presentation, the publisher may have deleted the file from their server. During download, if you can't get a presentation, the file might be deleted by the publisher.

E N D

Presentation Transcript


  1. Quantification of actin bundling by HsACTN4 and SpAin1

  2. Example impages Yellow: 1 filament Red: 2 Green: 3 Purple: 4 Blue: 5 +100 nM HsACTN4 3 uM actin +10 nM HsACTN4 +30 nM HsACTN4 +100 nM SpAin1 +30 nM SpAin1 +10 nM SpAin1

  3. Blue: HsACTN4Orange: SpAin1

  4. +30 nM HsACTN4 +100 nM HsACTN4 +10 nM HsACTN4 3 uM actin +100 nM SpAin1 +10 nM SpAin1 +30 nM SpAin1

  5. +30 nM HsACTN4 +100 nM HsACTN4 +10 nM HsACTN4 3 uM actin +100 nM SpAin1 +10 nM SpAin1 +30 nM SpAin1

More Related