Download
1 / 33
330 likes | 485 Views
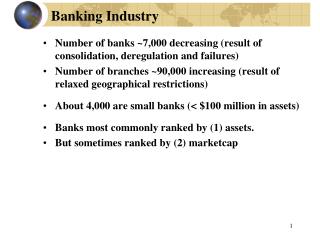
CHILEAN BANKING INDUSTRY. Arturo Tagle March 19, 2002. Financial System. Pension Funds US$36 Billion of funds under management. Banking Industry US$45 Billion of loans. Financial System. Insurance Companies US$12 Billion of financial investments. Total Loans / GDP.

E N D
CHILEAN BANKING INDUSTRY Arturo Tagle March 19, 2002
Financial System Pension Funds US$36 Billion of funds under management Banking Industry US$45 Billion of loans Financial System Insurance Companies US$12 Billion of financial investments
Chilean Financial System(As of December 31,2001) Number of Participants Loans (1) Net Income (1) Net of Interbank Loans Source: Superintendency of Banks.
Industry’s Structural ChangeBanking Consolidation Underway... Share of Loans (1) held by Top five Private Banks Share of Loans (1) held by foreign Banks December 1995 December 1995 December 2001 December 2001 Source: Superintendency of Banks. (1) Exclude interbank loans.
Loans Evolution(In Million of Nominal Ch$) CAGR: 9,1%
Loan Market Share (1)(As of December 31,2001) Source: Superintendency of Banks. (1) Net of interbank loans.
Deposits Evolution (1)(In Million of Nominal Ch$) CAGR: 10,4% (1) Time Deposits and Saving Account.
Checking Account(In Million of Nominal Ch$) CAGR: 9,1% Source: Superintendency of Banks.
System’s Loan Mix & Main Liabilities(As of December 31,2001) System’s Loan Mix (1) Main Liabilities Source: Superintendency of Banks. (1) Exclude interbank loans.
Loans Consumer Commercial Credit Lines Credit Cards Mortgage Lease Contracts Factoring Foreign trade Contingent Liabilities Time Deposits Saving Accounts Checking Accounts Retirement Saving Acc Bonds Main Products and Services • Services • Stock Brokerage • Mutual Fund • Financial Advisory • Investment Fund • Previsional Fund • Insurance Brockerage • Automatic Bill • Payments • Collections • Payroll Payments • Financial • Currency Forwards • Swaps • Interest rate Futures • Currency trading • Investments under • agreements to resell or • repurchase. • Others • Debit Cards • On-Line Funds Transfers • 24 hrs. Selfservice Sites • ATM’s
Basle’s Indicators 2001(In Million of Ch$, except for percentages)
Average interest rate spread (Interest rate charged - Interest rate paid) (1) (1) In terms of 90-365 day real rates .
Chilean Financial System Source: Superintendency of Banks. Unconsolidated data. (1) In US$ Millions as of December 31, 2001 (2) Data under 2001 correspond to June 2001. (3) Net Interes Revenue over Average Interest Earning Assets (4) Operating Expenses over Operating Revenues
Banco de Chile: after the merger with Banco Edwards The largest bank in Chile
The Chile Edwards transaction May -June ‘01: Studies were conducted by both banks.End of June ‘01: formal negotiations started. Each bank retained an investment bank as its advisor.August ‘01: -Boards of Directors announced they had reached an agreement. - Authorizations requests were presented (Central Bank, Superintendency of Banks and the SEC). - A team of executives and employees of both banks were appointed to establish the Merger Planning Office.October ‘01: Central Bank and Superintendency gave their approvalDecember ‘01: after the approval by the SEC, the Shareholders Meetings of both banks voted in favor of the merger.January ‘02: The merger becomes effective
The Chile - Edwards transaction: • The financial merits of the merger: • The transaction was considered accretive to both banks’ shareholders at relative valuation agreed 34:66. • An in-market combination between Banco de Chile and Banco Edwards is also expected to generate significant strategic value • Creation of the largest bank in Chile • Improve economies of scale and extract significant cost savings • Enhance access to capital by combining pools of stock liquidity • The transaction is not only an offensive move but also defensive • Blocks the ability of BBVA, Citibank and HSBC to become serious players in Chile • As in any merger, there are risks that need to be incurred to create the expected value
Acquisition premium for Edwards was 32% Acquisition premiums over market price2 – Chilean transactions U.S. acquisition premiums Median(%) % Average: 35.6% Implied premium over Edwards’ price1 = 32.3% Distribution of control premiums3 (U.S.) 1993-2000 Number of transactions 1 Implied premium over 30 days average price based on 34:66 relative valuations 2 Market price calculated as average of share price one month prior to announcement 3 Premium: final offe r vs. price five days prior to announcement Source: JP Morgan
Improved Subordinated debt servicing Stock liquidity Cost synergies Economies of scale The transaction strategic value
Scale and profitability in Latin América As of December 2000 Economies of scale Brazil Chile1 ROAE (%) ROAE (%) Chile Santander BCI Security Santiago BICE BHIF Sudamericano Edwards Assets (US$MM) Assets (US$MM) Mexico2 Argentina ROAE (%) ROAE (%) Assets (US$MM) Assets (US$MM) 1 Assets value adjusted for international accounting standards 2 In the case of Inverlat, ROE was used instead of ROAE Source: superintendencies, JPMorgan research
Cost sinergies Cost synergies Synergies and restructuring charges1,2 US$MM 37% of Edwards’ 2001E operating expenses4
Stock liquidity Average daily trading volume1 Stock liquidity US$ thousands 1 Calculated as average trading volume from 01/02/01 to 7/31/01
Ownership of Banco de Chile after the merger LQ (Luksic Group) J.Ergas Others (Float) TOTAL 52.16% 8.88% 38.96% 100.0% Direct Float 10.42%
Learning from previous experiences TECHNOLOGY • Early option for one of the existing platforms. • Two-Step Technologic Integration: • interconnection of two platforms • full integration in one platform CLIENT SERVICE • client retention incentives. • early definition of account officer for each client. • Account officer maintained in segments of Indiv.& Middle Mkt. Co.
Resulting Mainframe BCH+BE Mkt share BCH + BE System’s average ROAE 15.9% 15.8% ROAA 1.2% 1.2% NIM 4.2% 4.6% Efficiency (*) 54.9% 52.0% Past Due / Total Loans 2.1% 1.6% Allowances/ PD 186% 166% Loans (Net) Mill.US$ 8,849 19.5% Deposits Mill.US$ 10,419 19.3% Allowances Mill.US$ 280 25.6% Investments Mill.US$ 2,283 18.7% Branches # 281 20.4% ATM # 671 25.9% ATM Transac. #Th. 3,622 25.9% Current Accounts#Th. 359 27.4% Credit cards #Th. 311 19.7% (*) Efficiency without depreciation & amortization. Source: Superintendency of Banks and Financial Institutions.
Business Structure Consolidated Gross Margin (%) Retail Banking 34% Large Corporations 14% BANCO DE CHILE (100%) Treasury and Money Mkt. Oper. 14% Middle Market Banking 24% Other Financial Services 9% International Banking 5%
Loan Portfolio Allocation Outstanding Loans BCH+BE • By Market Segment(Jan.’02) Individuals CrediChile (Consumer) Large Companies Middle Mkt Companies
Operating Revenues & Expenses (BCh+BE) Efficiency Operating Revenues Operating Expenses Efficiency Merger costs deducted (1) 54.9% 51.1% 41.1% Salaries & Personnel Admin. Expenses Deprec.& Amortization Total 100% 342 Mill.US$ Net Interest Revenue Fees Oth. Op. Inc., net Total 100% 573 Mill.US$ 51.5% 82.8% 59.6% 56.2% 7.8% 14.7% 2.5%