Download

1 / 52
540 likes | 843 Views
Principal Components Analysis with SPSS. Karl L. Wuensch Dept of Psychology East Carolina University. When to Use PCA. You have a set of p continuous variables. You want to repackage their variance into m components. You will usually want m to be < p , but not always.

E N D
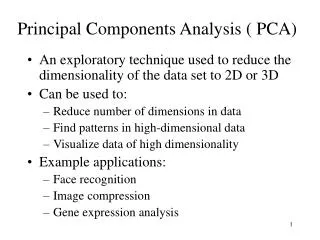
Principal Components Analysis with SPSS Karl L. Wuensch Dept of Psychology East Carolina University
When to Use PCA • You have a set of p continuous variables. • You want to repackage their variance into m components. • You will usually want m to be < p, but not always.
Components and Variables • Each component is a weighted linear combination of the variables • Each variable is a weighted linear combination of the components.
Factors and Variables • In Factor Analysis, we exclude from the solution any variance that is unique, not shared by the variables. • Uj is the unique variance for Xj
Goals of PCA and FA • Data reduction. • Discover and summarize pattern of intercorrelations among variables. • Test theory about the latent variables underlying a set a measurement variables. • Construct a test instrument. • There are many others uses of PCA and FA.
Data Reduction • Ossenkopp and Mazmanian (Physiology and Behavior, 34: 935-941). • 19 behavioral and physiological variables. • A single criterion variable, physiological response to four hours of cold-restraint • Extracted five factors. • Used multiple regression to develop a model for predicting the criterion from the five factors.
Exploratory Factor Analysis • Want to discover the pattern of intercorrleations among variables. • Wilt et al., 2005 (thesis). • Variables are items on the SOIS at ECU. • Found two factors, one evaluative, one on difficulty of course. • Compared FTF students to DE students, on structure and means.
Confirmatory Factor Analysis • Have a theory regarding the factor structure for a set of variables. • Want to confirm that the theory describes the observed intercorrelations well. • Thurstone: Intelligence consists of seven independent factors rather than one global factor. • Often done with SEM software
Construct A Test Instrument • Write a large set of items designed to test the constructs of interest. • Administer the survey to a sample of persons from the target population. • Use FA to help select those items that will be used to measure each of the constructs of interest. • Use Cronbach alpha to check reliability of resulting scales.
An Unusual Use of PCA • Poulson, Braithwaite, Brondino, and Wuensch (1997, Journal of Social Behavior and Personality, 12, 743-758). • Simulated jury trial, seemingly insane defendant killed a man. • Criterion variable = recommended verdict • Guilty • Guilty But Mentally Ill • Not Guilty By Reason of Insanity.
Predictor variables = jurors’ scores on 8 scales. Discriminant function analysis. Problem with multicollinearity. Used PCA to extract eight orthogonal components. Predicted recommended verdict from these 8 components. Transformed results back to the original scales.
A Simple, Contrived Example • Consumers rate importance of seven characteristics of beer. • low Cost • high Size of bottle • high Alcohol content • Reputation of brand • Color • Aroma • Taste
FACTBEER.SAV at http://core.ecu.edu/psyc/wuenschk/SPSS/SPSS-Data.htm . Analyze, Data Reduction, Factor. Scoot beer variables into box.
Click Descriptives and then check Initial Solution, Coefficients, KMO and Bartlett’s Test of Sphericity, and Anti-image. Click Continue.
Click Extraction and then select Principal Components, Correlation Matrix, Unrotated Factor Solution, Scree Plot, and Eigenvalues Over 1. Click Continue.
Click Rotation. Select Varimax and Rotated Solution. Click Continue.
Click Options. Select Exclude Cases Listwise and Sorted By Size. Click Continue. Click OK, and SPSS completes the Principal Components Analysis.
Checking for Unique Variables 1 • Check the correlation matrix. • If there are any variables not well correlated with some others, might as well delete them.
Checking for Unique Variables 2 Correlation Matrix cost size alcohol reputat color aroma taste cost 1.00 .832 .767 -.406 .018 -.046 -.064 size .832 1.00 .904 -.392 .179 .098 .026 alcohol .767 .904 1.00 -.463 .072 .044 .012 reputat -.406 -.392 -.463 1.00 -.372 -.443 -.443 color .018 .179 .072 -.372 1.00 .909 .903 aroma -.046 .098 .044 -.443 .909 1.00 .870 taste -.064 .026 .012 -.443 .903 .870 1.00
Checking for Unique Variables 3 • Bartlett’s test of sphericity tests null that the matrix is an identity matrix, but does not help identify individual variables that are not well correlated with others.
Checking for Unique Variables 4 • For each variable, check R2 between it and the remaining variables. • SPSS reports these as theinitial communalities whenyou do a principal axisfactor analysis • Delete any variable with alow R2 .
Checking for Unique Correlations • Look at partial correlations – pairs of variables with large partial correlations share variance with one another but not with the remaining variables – this is problematic. • Kaiser’s MSA will tell you, for each variable, how much of this problem exists. • The smaller the MSA, the greater the problem.
Checking for Unique Correlations 2 • An MSA of .9 is marvelous, .5 miserable. • Variables with small MSAs should be deleted • Or additional variables added that will share variance with the troublesome variables.
Checking for Unique Correlations 3 a. Measures of Sampling Adequacy (MSA) on main diagonal. Off diagonal are partial correlations x -1.
Extracting Principal Components 1 • From p variables we can extract p components. • Each of peigenvalues represents the amount of standardized variance that has been captured by one component. • The first component accounts for the largest possible amount of variance. • The second captures as much as possible of what is left over, and so on. • Each is orthogonal to the others.
Extracting Principal Components 2 • Each variable has standardized variance = 1. • The total standardized variance in the p variables = p. • The sum of the m = p eigenvalues = p. • All of the variance is extracted. • For each component, the proportion of variance extracted = eigenvalue / p.
Extracting Principal Components 3 • For our beer data, here are the eigenvalues and proportions of variance for the seven components:
How Many Components to Retain • From p variables we can extract p components. • We probably want fewer than p. • Simple rule: Keep as many as have eigenvalues 1. • A component with eigenvalue < 1 captured less than one variable’s worth of variance.
Visual Aid: Use a Scree Plot Scree is rubble at base of cliff. For our beer data,
Only the first two components have eigenvalues greater than 1. Big drop in eigenvalue between component 2 and component 3. Components 3-7 are scree. Try a 2 component solution. Should also look at solution with one fewer and with one more component.
Less Subjective Methods • Parallel Analysis and Velcier’s MAP test. • SAS, SPSS, Matlab scripts available athttps://people.ok.ubc.ca/brioconn/nfactors/nfactors.html
Parallel Analysis • How many components account for more variance than do components derived from random data? • Create 1,000 or more sets of random data. • Each with same number of cases and variables as your data set. • For each set, find the eigenvalues.
For the eigenvalues from the random sets, find the 95th percentile for each component. • Retain as many components for which the eigenvalue from your data exceeds the 95th percentile from the random data sets.
Random Data Eigenvalues Root Prcntyle 1.000000 1.344920 2.000000 1.207526 3.000000 1.118462 4.000000 1.038794 5.000000 .973311 6.000000 .907173 7.000000 .830506 • Our data yielded eigenvalues of 3.313, 2.616, and 0.575. • Retain two components
Velicer’s MAP Test • Step by step, extract increasing numbers of components. • At each step, determine how much common variance is left in the residuals. • Retain all steps up to and including that producing the smallest residual common variance.
Velicer's Minimum Average Partial (MAP) Test: Velicer's Average Squared Correlations .000000 .266624 1.000000 .440869 2.000000 .129252 3.000000 .170272 4.000000 .331686 5.000000 .486046 6.000000 1.000000 The smallest average squared correlation is .129252 The number of components is 2
Which Test to Use? • Parallel analysis tends to overextract. • MAP tends to underextract. • If they disagree, increase number of random sets in the parallel analysis • And inspect carefully the two smallest values from the MAP test. • May need apply the meaningfulness criterion.
Loadings, Unrotated and Rotated • loading matrix = factor pattern matrix = component matrix. • Each loading is the Pearson r between one variable and one component. • Since the components are orthogonal, each loading is also a β weight from predicting X from the components. • Here are the unrotated loadings for our 2 component solution:
All variables load well on first component, economy and quality vs. reputation. Second component is more interesting, economy versus quality.
Rotate these axes so that the two dimensions pass more nearly through the two major clusters (COST, SIZE, ALCH and COLOR, AROMA, TASTE). The number of degrees by which I rotate the axes is the angle PSI. For these data, rotating the axes -40.63 degrees has the desired effect.
Component 1 = Quality versus reputation. Component 2 = Economy (or cheap drunk) versus reputation.
Number of Components in the Rotated Solution • Try extracting one fewer component, try one more component. • Which produces the more sensible solution? • Error = difference in obtained structure and true structure. • Overextraction (too many components) produces less error than underextraction. • If there is only one true factor and no unique variables, can get “factor splitting.”
In this case, first unrotated factor true factor. But rotation splits the factor, producing an imaginary second factor and corrupting the first. Can avoid this problem by including a garbage variable that will be removed prior to the final solution.
Explained Variance • Square the loadings and then sum them across variables. • Get, for each component, the amount of variance explained. • Prior to rotation, these are eigenvalues. • Here are the SSL for our data, after rotation:
After rotation the two components together account for (3.02 + 2.91) / 7 = 85% of the total variance.
If the last component has a small SSL, one should consider dropping it. If SSL = 1, the component has extracted one variable’s worth of variance. If only one variable loads well on a component, the component is not well defined. If only two load well, it may be reliable, if the two variables are highly correlated with one another but not with other variables.
Naming Components • For each component, look at how it is correlated with the variables. • Try to name the construct represented by that factor. • If you cannot, perhaps you should try a different solution. • I have named our components “aesthetic quality” and “cheap drunk.”
Communalities • For each variable, sum the squared loadings across components. • This gives you the R2 for predicting the variable from the components, • which is the proportion of the variable’s variance which has been extracted by the components.
Here are the communalities for our beer data. “Initial” is with all 7 components, “Extraction” is for our 2 component solution.
Orthogonal Rotations • Varimax -- minimize the complexity of the components by making the large loadings larger and the small loadings smaller within each component. • Quartimax -- makes large loadings larger and small loadings smaller within each variable. • Equamax – a compromize between these two.