Download
1 / 45
470 likes | 666 Views
Life Cycle Assessment of BTL-fuels, Conversion Concepts and Comparison with Fossil Fuels. 16 th European Biomass Conference + Exhibition 2-6 June 2008 Valencia. Overview. Life cycle assessment of conversion concepts for BTL production LCA of BTL-fuel use and comparison with fossil diesel

E N D
Life Cycle Assessment of BTL-fuels, Conversion Concepts and Comparison with Fossil Fuels 16th European Biomass Conference + Exhibition 2-6 June 2008 Valencia
Overview • Life cycle assessment of conversion concepts for BTL production • LCA of BTL-fuel use and comparison with fossil diesel • Conclusions www.esu-services.ch
Questions addressed for BTL production • Which production route developed within the RENEW project is the one with the lowest environmental impacts for a certain impact category ? • Improvement options of production routes, e.g. biomass inputs • Priorities for process development • Scenarios for technology development for BtL-production plants and influence on results www.esu-services.ch
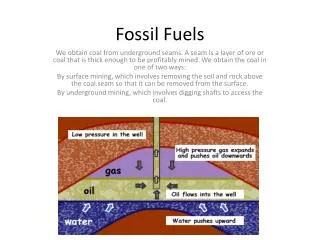
Total system boundaries www.esu-services.ch
System boundaries • No modelling of intermediate flows between conversion stages • Emissions of power plant are allocated to heat and electricity based on exergy production • No allocation of biomass input to by-products, like electricity • No agreement on assessment of pesticides and heavy metals in the project www.esu-services.ch
General assumptions necessary • Data provided had to be completed with general assumptions • Emission profile of conversion based mainly on gas or wood power plants • Waste and effluent composition available only from model calculation • Catalyst use assessed based on literature www.esu-services.ch
Key data of modelling for the year 2020 www.esu-services.ch
100% refinery treatment, FT-raw liquid 90% 80% BTL-fuel synthesis, wood UET 70% gas conditioning, wood UET 60% 50% gas cleaning, wood UET 40% 30% Carbo-V-gasifier, wood UET 20% 10% biomass storage and preparation, 0% Wood UET water use acidification process specific emissions, conversion eutrophication land occupation abiotic depletion plant global warming (GWP100) cumulative energy demand photochemical oxidation, non-b Refinery gas, burned in flare fuel synthesis plant infrastructure Contribution of sub-processes www.esu-services.ch
Well to tank comparisonStarting Point www.esu-services.ch
Interpretation - Wood • BLEF-DME lower than cEF-D for CED, abiotic depletion, global warming, eutrophication, acidification, water and land use • BLEF-DME higher impacts than cEF-D for photochemical oxidation • CFB-D 3rd rank for all category indicators • ICFB-D has highest impacts in all categories because of low conversion efficiency to fuel (but by-product electricity) www.esu-services.ch
Interpretation - Straw • cEF-D lowest impacts for the conversion of straw followed by the dEF-D and the CFB-D process • No clear recommendation comparing wood and straw • Only one conversion process using miscanthus (ICFB-D) www.esu-services.ch
General improvement options • Increase of FT-fuel yield • Reduce emissions (CH4, NMVOC, NOx, particles) with off-gases and from the power plant • Improve biomass provision and production • Recycling of nutrients in slag and ashes www.esu-services.ch
Life cycle assessment of using BTL • What are the environmental impacts of using BTL-fuels compared to fossil diesel? • Importance of fuel combustion for total environmental impacts? • GWP reduction potential • Comparison of BTL with first generation biofuels? • Yields per hectare compared to first generation? • Follow-up study commissioned by Swiss authorities www.esu-services.ch
Importance of process stages(Eco-indicator 99) • The environmental impacts of roads and cars are assumed to be the same for all fuels www.esu-services.ch
Global warming potential • GWP reduction between 28% and 69% is lower than what has been assumed so far
Comparison with other biofuels • No clear advantage nor disadvantage compared to other biofuels • Type of biomass resource is most important for each type of fuel www.esu-services.ch
Main observations • Low emissions of GHG during combustion outweigh the higher impacts of fuel production for GWP • Reduction potential for GWP and non-renewable energy is about 30%-69% if the full life cycle is taken into account • Other environmental impacts of BTL-fuel from agricultural biomass are higher than using fossil fuels • Comparison with first generation fuels and evaluation of fuel yields show no general better performance • Type of biomass and conversion efficiency important www.esu-services.ch
Data quality description www.esu-services.ch
System boundaries conversion www.esu-services.ch
Key data biomass • Straw, short-rotation wood and miscanthus per kg dry substance (DS) www.esu-services.ch
Intermediate StorageKey assumptions www.esu-services.ch
Biomass, at intermediate storage(per MJ biomass energy) www.esu-services.ch
Interpretation • Main factors are fertilizer and diesel use and emissions due to use of fertilizers • Small variations in scenarios • General uncertainty in agricultural data is higher than the differences between scenarios • Straw has lower impacts due to economic allocation, wood has higher or about the same impacts as miscanthus except for eutrophication www.esu-services.ch
dimethylether, black liquor, Chemrec BTL-fuel, wood, UET BTL-fuel, wood, TUV BTL-fuel, wood, CUTEC BTL-fuel, straw, UET BTL-fuel, straw, FZK BTL-fuel, straw, CUTEC BTL-fuel, miscanthus, TUV 0% 10% 20% 30% 40% 50% 60% 70% 80% 90% 100% Remaining flows Dimethyl ether Sulfur dioxide Carbon monoxide, biogenic Pentane Butane Hexane Analysis of individual pollutants, i.e. Photochemical Oxidation www.esu-services.ch
Scenarios • Starting point scenario provides a good basis for comparison of different conversion concepts • Scenario 1 shows what would be possible if fuel yield should be maximized at a certain place. Hydrogen produced with wind power is used to maximize the fuel production www.esu-services.ch
Key data scenario 1 www.esu-services.ch
Well to tank comparisonScenario 1 www.esu-services.ch
Interpretation, Scenario 1 • Only preferable if electricity supplied by wind power, but in this case high demand for capacity and supply security or flexibility • Higher impacts in case of external hydrogen production with European electricity mix • No clear ranking because of different advantages and disadvantages www.esu-services.ch
Change of resultsStarting point -> Sc1, European electricity mix www.esu-services.ch
Change of resultsStarting point -> Sc1, wind electricity www.esu-services.ch
UncertaintiesStraw, FZK against Wood, UET www.esu-services.ch
Fuel yields www.esu-services.ch
Share capital goods(starting point, MJ fuel) www.esu-services.ch
Capital goods • Share up to 40% • Exclusion would give wrong picture • Article published in the Int.J.LCA that gives further details and recommendations Frischknecht R, Althaus H-J, Bauer C, Doka G, et al., The environmental relevance of capital goods in life cycle assessments of products and services. Int. J. LCA, 2007. Online first. DOI: http://dx.doi.org/10.1065/lca2007.02.309. www.esu-services.ch
Limitations of the study • Pesticides, heavy metals and impacts of land occupation for biomass production not considered in the assessment • No agreement on reliability of assessment methodologies of toxicity impacts www.esu-services.ch
Peer ReviewLCA of BTL-fuel production • Peer review according to ISO14040 in general quite positive: • Requirements are fulfilled • Data structure and results are exemplary • Main critics are • No impact assessment for toxicological effects • No full cradle-to-grave LCA • No comparison to fossil fuel • Reports have been finalized and published on the RENEW homepage together with full review comment www.esu-services.ch
Questions to be answered • Using BTL reduces the GWP by X% compared to fossil fuel • Using a specific amount (e.g. 1 MJ or 1 kg) of BTL reduces the GWP by Y kg (or another appropriate unit) compared to fossil fuel
100% 38% 20% 15% 12% Calculations of potential reduction www.esu-services.ch
52% 65% Example GWP of BTL-Diesel • Neglecting parts of the life cycle leads to different conclusions concerning reduction potentials expressed as a percentage (Jungbluth et al. 2008: LCA of biomass-to-liquid fuels)
And again: How much better are biofuels? • If we want an answer like „the use of biofuel has ???% lower GWP than fossil fuels“ than we have to include the all parts of the life cycle, e.g. for transports also cars and streets • Neglecting certain parts of the life cycle, even if the same for both options, will bias the results • System boundaries must be stated correctly if comparing reduction figures, e.g. well-to-wheel should include the wheel • See www.esu-services.ch/btl/ for background paper
Concawe compared to RENEW results (fuel production) Range RENEW 27-65 www.esu-services.ch
Differences with Concawe study • Higher nitrogen input in RENEW study (5-6 vs. 2.5 g g/kg DS) ca. +50% N2O • Low emissions (CH4 and N2O) because no data for conversion in Concawe study ca. +10-20% in RENEW • No infrastructure in Concawe study +10-20% • Credits for electricity production with biomass power plant - mainly relevant for TUV www.esu-services.ch
BTL from short-rotation wood(IFEU study) www.esu-services.ch