Download
1 / 28
280 likes | 584 Views
Variance Estimation in the Presence of Nearest Neighbor Imputed Data. * Temesgen H., * B.N.I. Eskelson, and + T.M. Barrett * Dept. of Forest Resources, OSU, Corvallis, OR + PNW Research Station, Anchorage, AK Presented at Nearest Neighbors Workshop, Minneapolis, MN Aug. 28, 2006.

E N D
Variance Estimation in the Presence of Nearest Neighbor Imputed Data *Temesgen H., *B.N.I. Eskelson, and +T.M. Barrett *Dept. of Forest Resources, OSU, Corvallis, OR +PNW Research Station, Anchorage, AK Presented at Nearest Neighbors Workshop, Minneapolis, MN Aug. 28, 2006
Overview I) Background - Nearest Neighbor (NN) Imputation II) Variance Estimation Methods for imputed data III) NumericalExample - Objectives/Methods/ Results /Summary IV) Challenges and Opportunities V) References
I. Background • For natural resource planning, forested land is divided into polygons (stands) with same age, species composition, etc. • Complete census is obtained for aerial variables (X), using photos & remote sensing • Ground based inventory data (e.g., tree-lists) are available for some stands.
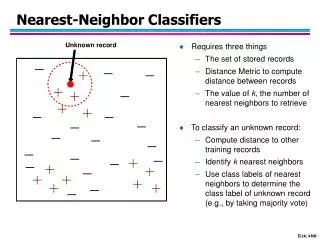
Nearest neighbor imputation • Non-sampled polygons lack ground data missing by design • NN methods (e.g., MSN, KNN, GNN, etc.) are used to “populate” forested land with detailed ground-based information (Y). • For landscape level analysis, observed and imputed values are used to estimate point (e.g., means and totals) and confidence intervals (reliability). • Imputation brings additional variance over the sampling variance.
Variance estimation for imputed data: • Treating imputed values as observed values and using ordinary variance formulas yield biased and inconsistent variance estimates. invalid inferences and reliability estimates • For design-based and other surveys, variance estimation for imputed data has been examined by Shao and Sitter (1996), Montaquila (1997), Sitter and Rao (1997), Chen and Shao (2001), etc.
Why is variance estimation for imputed data important? “… The oldest and simplest device for misleading folks is the barefaced lie. A method that is nearly as effective and far more subtle is to report a sample estimate without any indication of its reliability…” (Frank Freese 1967, p. 11) • to make valid inferences and reliability estimates
II. Variance Estimation Methods Used for Imputed Data • Model-assisted approaches (Rancourt et al. 1999) • Multiple imputation (Rubin 1996) • Replication methods such as jackknife (Chen and Shao 2001) and bootstrap (Shao and Sitter 1996) • All cases imputation variance estimator (Montaquila 1997) (1) loses the non parametric nature of NN imputation, (2) is mainly used for random imputation, and (3) require extensive computation, but provide valid variance estimates for NN imputed data.
II. Variance Estimation Methods (Cont’d) 3. Replication Methods • Pros: • do not require any explicit model or variance estimator, non-parametric • do not depend on mechanism or process of missing data. In some conditions, they might be the only method for estimating reliability • Cons: • do not partition components of the variance estimate – sampling error and imputation error • fail when sample size is small • computationally intensive
The Process for Generating Bootstrap Samples • From the combined (observed and imputed) data, randomly select a sample of size n with replacement (n is the no. of polygons). • Compute a bootstrap mean and variance using the bootstrap samples. • Repeat steps (1) and (2) k times. The Shao-Sitter bootstrap variance estimation method requires that each bootstrap sample should have a similar proportion of reference and target polygons, as the combined data.
II. Variance Estimation Methods (Cont’d) 4. All Cases Imputation (ACI, after Montaquila 1997) • Imputes a variable of interest to both sampled & non-sampled polygons, and then uses the relationships of imputed values to observed values for the sampled polygons to estimate variance. • Population total () to be estimated (under simple random sampling): R = sampled (reference) polygons T = non-sampled (target) polygonsej = imputation errora = area of a polygons = planning area * indicates imputed value If all polygons are sampled,
4. All Cases Imputation Variance Estimator(cont’d) Let The variance estimator for population total can be decomposed as: A nonzero covariance exists between repeatedly selected reference polygons and imputation error.
4. All Cases Imputation Variance Estimator(cont’d) Since yi is not observed for target polygons, the imputation error variance and covariance are estimated using sampled polygons. The AIC variance estimator for the population total: Sampling error Imputation error Imputation covariance error
4. All Cases Imputation Variance Estimator (cont’d) • Advantages: • helps to identify components of the variance estimate (sampling error, imputation error, and imputation covariance error) • can be easily extended to different sampling designs • not computationally intensive
III. Numerical Example Objectives: • Examine the performance of selected variance estimation methods in the presence of NN imputed data. • Examine components of variance estimated for NN imputed data.
Methods Data: • An average of 4 species in a polygon were observed. • 326 polygons were selected and ground (# of trees/ha, basal area/ha, and volume/ha) and aerial (stand age, slope, aspect, site index, % Douglas fir, % big leaf maple, etc.) variables were extracted. Correlations, 326 Stands
Most similar neighbor (MSN) imputation • Data were split into reference (with X and Y sets) and target (only with X sets) polygons • Most similar neighbor (MSN) (Moeur and Stage 1995) imputation was used to extend ground data to non-sampled polygons
MSN imputation (cont’d) • Three imputation rates: 20, 50, and 80%, were examined to extend ground data to non-sampled polygons • After MSN imputation, five variance estimation methods were examined: 1: Naïve variance estimator 2: All Cases Imputation (ACI) variance estimator 3: Naïve Jackknife 4: Naïve Bootstrap 5: Shao-Sitter Bootstrap
For each imputation rate: • variance was estimated and the performance of the ACI, jackknife, and bootstrap methods were compared for each ground variable (BA, VOL, and TPH) • total variance was partitioned into sampling error, imputation error, and imputation covariance error
Variance of the mean for ground variables for 50% imputation rate • Sizeable differences were observed among the variance estimation methods. • The variance estimated using the ACI and Shao-Sitter methods were higher than those estimated by the naïve jackknife and bootstrap methods.
Results (Cont’d) – Components of Variance (Std2) • The variance of imputation error (Imp) and imputation covariance error (Cov_imp) increased with an increase of imputation rate. • The variance of imputation error is not severe when the imputation rate is low.
Summary • The ACI variance estimator partitions the total variance. As expected, sampling error, imputation error, and imputation covariance error increased with an increase of imputation rate. • The magnitude of the imputation variance guides future forest inventory and planning endeavors. • In selecting a variance estimator, trade-offs between accuracy, cost, and simplicity should be considered (Wolter 1985).
IV. Challenges and opportunities 1.Extending the ACI variance estimator to stratified and multi-stage sampling designs and multivariate data. 2.Examining other replication methods (e.g., partial replication methods). 3. Updating variance estimate in presence of over time.
V. References Chen, J. and Shao, J. 2001. Jackknife variance estimation for nearest-neighbor imputation. J. of the American Statistical Association, Vol. 96, No. 453: 260-269. Freese, F. 1967. Elementary Statistical Methods for Foresters. US Dept. of Agriculture, Forest Service. Agriculture Handbook 317. 87 pp. Moeur, M. and A.R. Stage. 1995. Most similar neighbour: an improved sampling inference procedure for natural resource planning. For. Sci. 41: 337-359. Montaquila, J. 1997. A new approach to variance estimation in the presence of imputed data. PhD dissertation. American university. 149 pp. Shao, J. and Sitter, R.R. 1996. Bootstrap for imputed survey data. Journal of the American Statistical Association. 91: No. 435: 1278-1287. Rancourt, E. 1999. Estimation with nearest of-neighbor imputation at Statistics Canada. Proceedings of the Section on Survey Research Methods, American Statistical Association, 131-138. Rubin, D.B. 1996. Multiple imputation after 18+ years. Journal of the American Statistical Association. 91: 473-489. Wolter, K. M. 1985. Introduction to variance estimation. Springer, NY, 427 pp.
Acknowledgments We thank: Dr. Albert Stage and Nicholas Crookston at USDA Moscow Research Lab Dr. Jill Montaquila at Westat Inc. Prof. Randy Sitter at Simon Fraser University