Download
1 / 37
370 likes | 663 Views
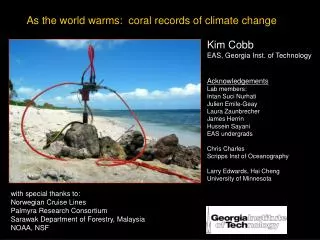
As the world warms: coral records of climate change. Kim Cobb EAS, Georgia Inst. of Technology Acknowledgements Lab members: Intan Suci Nurhati Julien Emile-Geay Laura Zaunbrecher James Herrin Hussein Sayani EAS undergrads Chris Charles Scripps Inst of Oceanography

E N D
As the world warms: coral records of climate change Kim Cobb EAS, Georgia Inst. of Technology Acknowledgements Lab members: Intan Suci Nurhati Julien Emile-Geay Laura Zaunbrecher James Herrin Hussein Sayani EAS undergrads Chris Charles Scripps Inst of Oceanography Larry Edwards, Hai Cheng University of Minnesota with special thanks to: Norwegian Cruise Lines Palmyra Research Consortium Sarawak Department of Forestry, Malaysia NOAA, NSF
Which of the following are scientific statements? • Reducing CO2 emissions would hurt the economy. • 2) Improved technology is the best way to slow global • warming. • 3) A warming of 1ºC over the next 50yrs is dangerous. • 4) Global temperatures were 5ºC colder during the Last • Glacial Maximum. • 5) Hurricane Katrina was caused by global warming.
Which of the following are scientific statements? • Reducing CO2 emissions would hurt the economy. • 2) Improved technology is the best way to slow global • warming. • 3) A warming of 1ºC over the next 50yrs is dangerous. • 4) Global temperatures were 5ºC colder during the Last • Glacial Maximum. • 5) Hurricane Katrina was caused by global warming.
Why do 99.999% of climate scientists believe that CO2 is warming the planet? • Theory predicts that increasing atmospheric CO2 should warm the planet. • Geologic evidence links CO2 and temperature in the past. • The warming is unprecedented in the most recent centuries (dwarfs natural variability). • Climate models show that rising CO2 is necessary to simulate • 20th century temperature trends (solar and volcanic minor players).
Ice core climate and CO2 records tiny gas bubbles in the ice trap ancient air samples
#2 Atmospheric CO2 and temperature over the past 650 thousand years CO2 and temperature are closely linked on geologic timescales
To understand how climate has changed in the past, we need to use records of climate preserved in ice cores, ancient tree rings, coral bands, and other “paleoclimatic” sources: key is to CALIBRATE to temperature records
#3 The “Hockey Stick” Key Points: error bars increase as you go back in time natural variability accounts for <0.5ºC over the last millennium late 20th century temperature trend is unprecedented
#4 anthropogenic only Solar and volcanic only Intergovernmental Panel on Climate Change (IPCC) 2001 natural & anthropogenic
The uncertain climate future Range of scenarios: Strict international agreements CO2 at 600ppm by 2100 *390ppm today Mid-ground 850ppm by 2100 280ppm 1800 Business as usual 1550ppm by 2100 IPCC AR4, 2007
but we need to know about regional climate changes, and specifically about regional precipitation changes white = models disagree color = models mostly agree stippled = models agree IPCC AR4, 2007
Research Goal: constrain tropical Pacific response to anthropogenic global warming Approach: reconstruct tropical Pacific climate at high-resolution for the last millennium El Niño Temperature WHY? “El Niño-Southern Oscillation” (ENSO) ENSO is a climate pattern in the tropical Pacific which arises from coupled interactions between the atmosphere and ocean ENSO impacts global climate every 2-7 years (huge impact on rainfall) Tropical Pacific climate variability over decades to centuries to millennia poorly constrained El Niño Precipitation Dai and Wigley, 2000
ENSO std in control run ENSO std Observed ENSO std in GHG run El Niño La Niña Tropical Pacific climate and global warming both more El Niño’s Collins et al., 2004 • We don’t know how the tropical Pacific will respond to global warming, if at all. • Studies are contradictory because: • climate data are scarce prior to 1950 • climate models do not simulate ENSO • accurately Timmermann et al., 1999 more La Niña-like Cane et al., 1997
Research Questions How has the tropical Pacific climate system responded to CO2 forcing? What aspects of present tropical Pacific climate are unprecedented? compare last several decades to recent centuries Palmyra 1997-? Fanning 2005-? Christmas 1998-?
Corals: The geologic record of El Niño Living Porites corals provide records for the last 200 years CORALS from the tropical Pacific record El Niño’s in the geochemistry of their skeletons Fossil Porites corals enable us to extend the record back many centuries
Generating climate reconstructions from the Palmyra corals: • Recover the corals, both modern (~10) and fossil (~100). • 2) Prove that the coral geochemistry tracks large-scale climate. • ie. Calibrate the modern coral record against the instrumental record of climate. • Apply geochemistry to fossil corals and date them (U/Th dating). Aerial view of Palmyra
Medieval Warm Period (MWP) Greenland green Little Ice Age (LIA) canals frozen in Europe The Palmyra Island Coral Collection Modern
Overlapping fossil corals: ancient El Niño events Good reproducibility between coral geochemical records increases confidence in coral climate reconstructions.
A millennium-long reconstruction of tropical Pacific temperature Key climate observations: 1) late 20th century warming is unprecedented in the last millennium 2) no cooling during the Northern Hemisphere’s “Little Ice Age” 3) significant cooling implied during the NH’s “Medieval Warm Period”
Conclusions • paleoclimate data have an important role to play in • global climate research • - corals provide quantitative reconstructions of temperature • evidence for ongoing tropical Pacific climate change that could • shape future global temperature and precipitation patterns • A climate scientist’s plea: • Get your climate information from a climate scientist • (not the media, politicians, etc) • Use flourescent light bulbs, don’t drive SUVs, a
The uncertain sea level future • The Earth’s ice is melting, • sea level has increased • ~3 inches since 1960 • ~1 inch since 1993 • signs of accelerating • melting are now clear • -land ice particularly • striking, poles more • complicated • IPCC estimates project • current trends forward • i.e. LOWER estimate • using no acceleration
Sea level rise: IPCC says 7” to 22” by 2100, much more if rapid ice sheet collapse occurs most scientists would go on record for 1m rise (30 inches)
uneven warming will shift rainfall patterns Projected temperature change: global view Take-homes: -poles warm more -land warms more -ocean warming patchy and complex
Regional models use global model output, run at high-resolution (5km) grid Length of heat waves increase (# days/event) Peak temperatures increase Diffenbaugh et al, 2005 US http://www.usgcrp.gov/usgcrp/nacc/se-mega-region.htm
Projected precipitation change: global view white = models disagree color = models mostly agree stippled = models agree Projecting precipitation is VERY uncertain business, yet extremely critical to human impacts.
Projected precipitation change: regional view change in yearly average precipitation # dry days # heavy rain days mm/day days/yr days/yr Diffenbaugh et al, 2005
IPCC says increase in hurricane intensity “likely” (66%)
CERTAIN Warming of 1-6°C by 2100. Sea levels will rise by 6 to 30 inches by 2100. Precipitation patterns will change. More erratic precipitation. Extreme events will increase, hurricanes more intense. Prospect of abrupt climate change. UNCERTAIN
What is a country to do? • There are only three (prudent) options: • use less energy • - drive less, drive smaller (plug-in?) cars • - conserve electricity • - recycle, reuse • 2) make “clean” energy • - solar power, wind power, nuclear energy • 3) take CO2 out of the sky (much more difficult) …. but how much at what cost?
Some clear lessons: • 1) efficiency makes $$ • gains from cellulosic • biofuels likely (not • corn ethanol!) • 3) taking CO2 out of the sky • is more costly than • not putting it in the • atmosphere to begin with
Scientific Summary • Strong evidence supports the idea that anthropogenic CO2 is warming the planet. • Future climate changes in a warming environment are still uncertain, although: • -sea level rise certain (but how much by when?, ~1m starting point) • - SE precipitation will become more erratic (water resource management) • -prospect for increasing hurricane activity A Climate Scientist’s Plea Evaluate the scientific evidence for yourselves, from a scientific source. Distinguish between the science of global warming and the politics/economics of global warming. My homepage: http://shadow.eas.gatech.edu/~kcobb