Download
1 / 16
160 likes | 440 Views
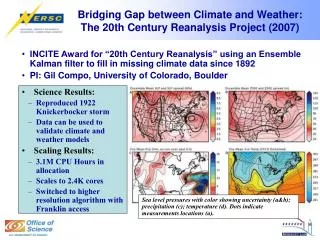
The 20th Century Reanalysis Project. Jeff Whitaker, Gil Compo, Nobuki Matsui and Prashant Sardesmukh NOAA/ESRL and Univ. of Colorado/CIRES. The 20th Century Reanalysis. What : A 6-hourly reanalysis from 1892-present (1918-1949 done so far), using only surface pressure observations. Why :

E N D
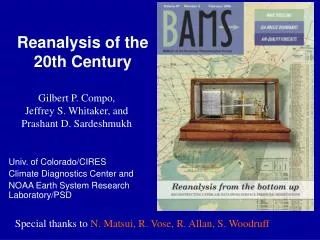
The 20th Century Reanalysis Project Jeff Whitaker, Gil Compo, Nobuki Matsui and Prashant Sardesmukh NOAA/ESRL and Univ. of Colorado/CIRES
The 20th Century Reanalysis • What: • A 6-hourly reanalysis from 1892-present (1918-1949 done so far), using only surface pressure observations. • Why: • No daily gridded tropospheric-wide circulation dataset before 1948 exists. • Evaluate models, understand causes for 20th century climate variations (e.g. 30’s U.S. drought, 20-40’s polar warming). • How: • 56 member Ensemble Kalman Filter, T26L28 CFS03 model. • Includes analysis error estimate.
Feasibility OSE • Subset of operational ps obs for DJF 2004/2005. • EnKF with CFS at T62, 3DVar and 4DVar with ECMWF IFS at T159 (courtesy Jean-Noel Thepaut). • OSE with 1998 GFS in Feb 2006 BAMS.
EnKF Error=34 m NCEP Operational EC 4DVar Error=31 m EC 3DVar Error=104 m
Anom Corr = 0.87 Anom Corr = 0.90 T700 Verification - Independent Obs(courtesy S. Bronniman and A. Grant, ETH) MAE = 1.58 K Expected Error = 1.71 K* MAE = 1.59 K Expected Error = 1.73 K* * Assumes observation error of 1.5 K
Anom Corr = 0.96 Z500 Verification - Independent Ob(courtesy S. Bronniman and A Grant, ETH) MAE = 25.8 m Expected Error = 23.7 m* * Assumes observation error of 20 m
Analyzed Anomalies (1918-1948 base period) with Z500 field 1930’s U.S. Drought(Precip) Observed Anomalies (1895-2000 base period)
Analyzed Anomalies (1918-1948 base period) with MSLP field 1930’s U.S. Drought(Precip) Observed Anomalies (1895-2000 base period)
Analyzed Anomalies (1918-1948 base period) with Z500 field 1930’s U.S. Drought(Temperature) Observed Anomalies (1895-2000 base period)
Summary • Accuracy: Mid-tropospheric circulation fields about as accurate as a 3-day forecast today. • Timeline: 1918-1949 done, full 1892-present done by end of 2008. • Data Access: Will be freely available from NCAR, NOAA/ESRL and NOAA/NCDC. 1918-1949 in early 2008, rest late 2008/early 2009. • For status updates, email jeffrey.s.whitaker@noaa.gov or gilbert.p.compo@noaa.gov