Download

1 / 58
580 likes | 1.15k Views
OVERVIEW OF CURRICULUM-BASED MEASUREMENT AS A GENERAL OUTCOME MEASURE . Mark R. Shinn, Ph.D. Michelle M. Shinn, Ph.D. Lisa A. Langell, M.A., S.Psy.S. AIMSweb in a Picture and a Sentence.

E N D
OVERVIEW OF CURRICULUM-BASED MEASUREMENT AS A GENERAL OUTCOME MEASURE Mark R. Shinn, Ph.D. Michelle M. Shinn, Ph.D. Lisa A. Langell, M.A., S.Psy.S.
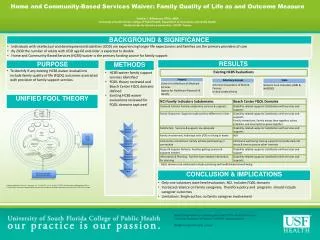
AIMSweb in a Picture and a Sentence AIMSweb is a 3-tier Progress Monitoring System based on direct, frequent and continuous student assessment which is reported to students, parents, teachers and administrators via a web based data management and reporting system for the purpose of determining response to instruction.
CBM is a GOM Used for Scientific Reasons Based on Evidence Reliable and valid indicator of student achievement Simple, efficient, and of short duration to facilitate frequent administration by teachers Provides assessment information that helps teachers plan better instruction Sensitive to the improvement of students’ achievement over time Easily understood by teachers and parents Improves achievement when used to monitor progress
Things to Always Remember About CBM Designed to serve as “indicators” of general reading achievement: CBM probes don’t measure everything, but measure the importantthings. Standardized teststo be given, scored, and interpreted in astandard way Researchedwith respect to psychometric properties to ensure accurate measures of learning
Skill Areas Currently Assessable via AIMSweb: • Early Literacy[K-1 benchmark, Progress Monitor (PM) any age] • Letter Naming Fluency • Letter sound fluency • Phonemic Segmentation Fluency • Nonsense Word Fluency • Early Numeracy (K-1 benchmark, PM any age) • Oral Counting • Number identification • Quantity discrimination • Missing number • Oral Reading (K-8, PM any age) • MAZE (Reading comprehension); (1-8, PM any age) • Math Computation (1-6, PM any age) • Math Facts (PM any age) • Spelling (1-8, PM any age) • Written Expression (1-8, PM any age) • Early Literacy and Oral Reading—Spanish (K-8)
Big Ideas of Benchmark (Tier 1) Assessment Benchmarking allows us to add systematic Formative Evaluation to current practice. • For Teachers (and Students) • Early Identification of At Risk Students • Instructional Planning • Progress Monitoring • For Parents • Opportunities for Communication/Involvement • Accountability • For Administrators • Resource Allocation/Planning and Support • Accountability
Benchmark (Tier 1):3x per year Strategic Monitoring (Tier 2):1x per month for select studentsat risk for educational difficulties(Optional) Progress Monitor (Tier 3):Intensive assessment with adjustable frequency that matches need
Managing Data after Assessment is Easy: • After completing assessment, quickly type data in system. • AIMSweb instantly generates multiple reports for analysis and various decision-making purposes. A few of the many reports available appear here: SAMPLES
Tier 1: Benchmark • Three times per year for all students. • Fall: SeptemberWinter: JanuarySpring: May
Box & Whiskers Graphs (box plots): A Brief Explanation AIMSweb commonly uses box plots to report data. This chart will help familiarize yourself with box plots: Consider bell-curve. Box plots are somewhat similar in shape and representation. outlier 90th percentile Above Average Range 75th percentile Median (50th percentile) 25th percentile Average range of population included in sample. Below Average Range 10th percentile
Tier 2: Strategic Monitor (Monthly) Provides option to increase assessment frequency for select students who have been identified as at-risk in the Benchmark process – or for all students if desired.
Compare Average Student Performance by Benchmark & Across Years
View Growth Trends by Grade and Benchmark Period; View by Comparison Group & Across Years
Compare Average Performance by Sub-Group • Compare by: • Service Code • Ethnicity • ELL/ESL • Meal Status • Various targets
School Reporters May View By Grade Level Data: Options Shown Below
View Data by Scores and Percentile Rank per Grade Level within a school or by specific Classroom
Progress Monitoring Strategies for Writing Individual Goals in General Curriculum and More Frequent Formative Evaluation Mark Shinn, Ph.D.Lisa A. Langell, M.A., S.Psy.S.
Big Ideas About Frequent Formative Evaluation Using General Outcome Measures and the Progress Monitoring Program One of the most powerful interventions that schools can use is systematic and frequent formative evaluation. Benchmark Assessment is not enough for some students because they may be in ineffective programs too long. (3 mos +) The solution is to write individualized goals and determine a feasible progress monitoring schedule. The core of frequent progress monitoring is: Survey-Level Assessment Goal setting using logical educational practices Analysis of student need and resources for determining progress monitoring frequency.
With Very Low Performers, Not Satisfactory to Wait This Long!
Formative Evaluation of Vital Signs Requires Quality Tools Technical adequacy (reliability and validity); Capacity to model growth (able to represent student achievement growth within and across academic years); Treatment sensitivity (scores should change when students are learning); Independence from specific instructional techniques (instructionally eclectic so the system can be used with any type of instruction or curriculum); Capacity to inform teaching (should provide information to help teachers improve instruction); Feasibility (must be doable).
Thinking About A Student’s Data Sample Student: Melissa Smart 3rd grade student Progress Monitor
8 Melissa Smart 110 92 77 50 34