Download
1 / 51
510 likes | 1.21k Views
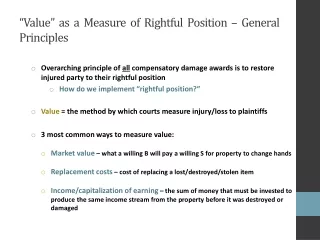
OVERVIEW OF CURRICULUM-BASED MEASUREMENT AS A GENERAL OUTCOME MEASURE . Mark R. Shinn, Ph.D. Michelle M. Shinn, Ph.D. . Formative Evaluation to Inform Teaching.

E N D
OVERVIEW OF CURRICULUM-BASED MEASUREMENT AS A GENERAL OUTCOME MEASURE Mark R. Shinn, Ph.D. Michelle M. Shinn, Ph.D.
Formative Evaluation to Inform Teaching • Summative Assessment: Culmination measure. Mastery assessment. Pass/fail type assessments which summarize the knowledge students learn. Typical summative assessments include: • End of chapter tests • High-stakes tests (e.g., State assessments) • GRE, ACT, SAT, GMAT, etc. tests • Driver’s license test • Final Exams. • Formative Evaluation: Process of assessing student achievement during instruction to determine whether an instructional program is effective for individual students. • Informs: • When students are progressing, continue using your instructional programs. • When tests show that students are not progressing, you can change • your instructional programs in meaningful ways.
Big ideas of Benchmark Assessment • It’s about using General Outcome Measures (GOMs) for formative assessment/evaluation to: • Inform teaching AND • ensure accountability. • It’s different from, but related to, summative high-stakes testing/evaluation, which: • Doesn’t inform teaching. • Mostly used for accountability/motivation.
Today’s High Stakes Evaluation World • High Stakes Tests are USUALLY appropriate for only for summative evaluation. • NOT useful for decisions teachers need to make every day (formative): • For whom do I need to individualize instruction or find more intensive instructional programs? • How do I organize my classrooms for instructional grouping? • How do I know that my teaching is “working” for each student so that I can make changes in instruction when necessary? • NOT very useful to administrators who must make decisions about allocating instructional resources, especially in a preventative or responsive model.
High Stakes Evaluation World (continued) • Reliability/Validity issues on High-stakes tests: • Guessing factor (bubble-in, skipping items, etc.) • Cheating—at various levels • Culture-sensitivity concerns • Test may not match what is taught • Fatigue • Enabling behaviors may not be present for test that is required • Text anxiety • Political pressures on student performance • Testing often takes place after year(s) of instruction with long time frames between (annual). • Information about success and failure rates provided too late to make changes. • Primary use of high stakes tests then may be to “assign the blame” to students, their parents, teachers, or schools.
High Stakes Evaluation World (continued) • High Stakes = High cost in terms of: • Loss of instructional time. • Time for test taking. • Paying for the tests. • In summary, typical High Stakes Testing is: • Too little! • Too late! • At too high a cost!
An Example: Weight • High standard: All children will have a healthy weight by the end of third grade. • High Stakes Assessment: Based on assessing body density. • Weighing each student. • Immersing each student in a large tub filled with water, and measuring the amount of water displaced. • Divide weight by displacement and get density, a very accurate picture of physical status.
Weight (continued) • After 8-9 YEARS of growth, we would: • Place students who are “unhealthy” in remedial programs. • Create new health programs. • Blame the effectiveness of old health programs. • Blame the students (or their families) for over - or under - eating.
Formative Evaluation: Same Standard - Different Assessment High Standard: All children will have a healthy weight by the end of third grade. Benchmark Assessment: Monitor weight directly, frequently, and continuously. From birth, measure weight frequently and continuously with a simple, albeit less precise, general outcome measure, weight in pounds, using a scale.
At ANY Point in Development • The child could be weighed and a decision made about healthy weight. • This process is: • Efficient. • Sufficiently accurate. • Proactive. • Cost effective • We would know their health status before they reached the high stakes point!
AIMSweb in a Picture and a Sentence AIMSweb is a 3-tier Progress Monitoring System based on direct, frequent and continuous student assessment which is reported to students, parents, teachers and administrators via a web based data management and reporting system for the purpose of determining response to instruction.
Common Characteristics of GOMs • The same kind of evaluation technology as other professions • Powerfulmeasures that are: • Simple • Accurate • Efficientindicators of performancethat guide and informa variety of decisions • Generalizable thermometer that allows for reliable, valid, cross comparisons of data
General Outcome Measures (GOMs) from Other Fields Medicine measures height, weight, temperature, and/or blood pressure. Federal Reserve Board measures the Consumer Price Index. Wall Street measures the Dow-Jones Industrial Average. Companies report earnings per share. McDonald’s measures how many hamburgers they sell.
CBM is a GOM Used for Scientific Reasons Based on Evidence Reliable and valid indicator of student achievement Simple, efficient, and of short duration to facilitate frequent administration by teachers Provides assessment information that helps teachers plan better instruction Sensitive to the improvement of students’ achievement over time Easily understood by teachers and parents Improves achievement when used to monitor progress
Things to Always Remember About CBM Designed to serve as “indicators” of general reading achievement: CBM probes don’t measure everything, but measure the importantthings. Standardized teststo be given, scored, and interpreted in astandard way Researchedwith respect to psychometric properties to ensure accurate measures of learning
Items to Remember (continued) Are sensitive to improvement in brief intervalsof time Also tell us how students earned their scores (qualitative information) Designed to be as short as possible to ensure its “do ability” Are linked to decision making for promoting positive achievement and Problem-Solving
What is CBM? • CBM is a form of Curriculum-Based Assessment (CBA). • Curriculum-Based Measurement (CBM) is the method of monitoring student progress through direct, continuous assessment of basic skills. • CBM is used to assess skills such as reading fluency, comprehension, spelling, mathematics, and written expression. Early literacy skills (phonics and phonological awareness) are similar measures and are downward extensions of CBM. • CBM probes last from 1 to 4 minutes depending on the skill being measured and student performance is scored for speed and accuracy to determine proficiency. Because CBM probes are quick to administer and simple to score, they can be given frequently to provide continuous progress data. The results are charted and provide for timely evaluation based on hard data.
Origins of CBM as General Outcome Measures Curriculum-Based Measurement (CBM) was developed more than 20 years ago by Stanley Deno at the University of Minnesota through a federal contract to develop a reliable and valid measurement system for evaluating basic skills growth. CBM is supported by more than 25 years of school-based research by the US Department of Education. Starting in the area of reading, researchers have expanded to investigate additional academic areas over the years. With significant additional research, AIMSweb now offers CBM assessments in 7 areas and 2 languages, with new areas currently being tested and developed. Supporting documentation can be found in 100’s of articles, book chapters, and books in the professional literature describing the use of CBM to make a variety of important educational decisions.
Skill Areas Currently Assessable via AIMSweb: • Early Literacy[K-1 benchmark, Progress Monitor (PM) any age] • Letter Naming Fluency • Letter sound fluency • Phonemic Segmentation Fluency • Nonsense Word Fluency • Early Numeracy (K-1 benchmark, PM any age) • Oral Counting • Number identification • Quantity discrimination • Missing number • Oral Reading (K-8, PM any age) • MAZE (Reading comprehension); (1-8, PM any age) • Math Computation (1-6, PM any age) • Math Facts (PM any age) • Spelling (1-8, PM any age) • Written Expression (1-8, PM any age) • Early Literacy and Oral Reading—Spanish (K-8)
Advantages of CBM • Direct measure of student performance. • Correlates strongly with “best practices” for instruction and assessment, and research-supported methods for assessment and intervention. • Focus is on repeated measures of performance.(This cannot be done with most norm-referenced and standardized tests due to practice effect or limited forms.)
Advantages of Using CBM • Quick to administer, simple, easy, and cost-efficient. • Performance is graphed an analyzed over time • Sensitive to even small improvements in performance This is KEY—as most standardized/norm-referenced tests do NOT show small, incremental gains. • CBM allows teachers to do what they do better! • Capable of having many forms—whereas most standardized tests only have a maximum of two forms. • Monitoring frequently enables staff to see trends in individual and group performance—and compare those trends with targets set for their students.
Big Ideas of Benchmark (Tier 1) Assessment Benchmarking allows us to add systematic Formative Evaluation to current practice. • For Teachers (and Students) • Early Identification of At Risk Students • Instructional Planning • Progress Monitoring • For Parents • Opportunities for Communication/Involvement • Accountability • For Administrators • Resource Allocation/Planning and Support • Accountability
Benchmark Testing: Useful for Communicating with Parents Designed for collaboration and communication with parents. Student achievement is enhanced by the teacher-parent communication about achievement growth on a continuous basis. A Parent Report is produced for each Benchmark Testing.
2006 School Calendar Year (2006-2007):Benchmarking (Tier 1) 2007 2-weeks during:September 1 to October 15 January 1 to February 1 May 1 to June 1
Benchmark (Tier 1) for Oral Reading (R-CBM) 1 • Set of 3 probes (passages) at grade-level* (~1 through 8). • Administer the same set, three times per year, to all students. • Requires 3 minutes per student, 3 times per year. 2 3
How the AIMSweb System Works for Benchmark (Tier 1):Oral Reading (R-CBM) as an Example • Research suggests there is no significant practice effect by repeating the set of three passages for benchmark assessment periods. • Using same passage sets for each benchmark increases confidence in data obtained, reduces extraneous variables. • Students read aloud for 1 minute from each of the three Edformation Standard Reading AssessmentPassages. • Passages contain meaningful, connected text. • Number of words read correctly (wrc) and number of errors are counted per passage read. • Scores reported as WRC/errors
Benefits of Using Edformation’s Standard Reading Assessment Passages Passages are written to represent generalcurriculumor to be “curriculum independent”For additional data on R-CBM passages, review: Allow decision making about reading growth, regardless of between-school, between-school-district, between-teacher differences in reading curriculum Are graded to be of equal difficulty Have numerous alternate forms for testing over time without practice effects Standard Reading Assessment Passages for Use in General Outcome Measurement: A manual describing development and technical features.Kathryn B. Howe, Ph.D. & Michelle M. Shinn, Ph.D.
Sample R-CBM Assessment Passage — Student Copy • Standard Reading Assessment Passage Student Copy: • No numbers • Between 250-300 words (exception: 1st grade) • An informative first sentence • Same font style and size • Text without pictures
Sample R-CBM Assessment Passage — Examiner Copy Standard Reading Assessment Passage Examiner Copy: Pre-numbered so they can be scored quickly and immediately.
Data: Get the MEDIAN score for student’s 3 passages: 67 / 2 85 / 8 74 / 9 1 min. 1 min. 1 min. Why use Median vs. Average? Averages are susceptible to outliers when dealing with small number sets.Median Score is a statistically more reliable number than average for R-CBM.
The Data: Get the MEDIAN score for 3 passages: 67 / 2 85 / 8 74 / 9 1 min. 1 min. 1 min. 1. Throw out the HIGH and LOW scores for Words Read Correct
The Data: Get the MEDIAN score for 3 passages: 67 / 2 85 / 8 74 / 9 1 min. 1 min. 1 min. 2. Throw out the HIGH and LOW scores for the Errors. Remaining scores = MEDIAN. 3. Report this score in your AIMSweb account. =74/8
Managing Data after Assessment: • Take median score for each student and report in AIMSweb System. • AIMSweb instantly generates multiple reports for analysis and various decision-making purposes. A few of the many reports available appear here: =74/8 SAMPLES
Box & Whiskers Graphs (box plots): A Brief Explanation AIMSweb commonly uses box plots to report data. This chart will help familiarize yourself with box plots: Consider bell-curve. Box plots are somewhat similar in shape and representation. outlier 90th percentile Above Average Range 75th percentile Median (50th percentile) 25th percentile Average range of population included in sample. Below Average Range 10th percentile
Finally… Benchmark Testing, using simple general, RESEARCHED outcome measures, provides an ONGOING data base to teachers, administrators, and parents for making decisions about the growth and development of basic skills. Professionally managed by staff in a process that communicates that WE are in charge of student learning.