Download
1 / 16
170 likes | 1.17k Views
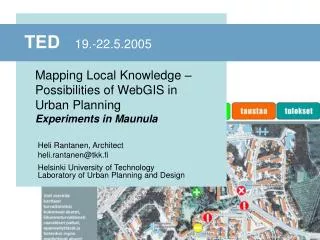
TED 19.-22.5.2005. Mapping Local Knowledge – Possibilities of WebGIS in Urban Planning Experiments in Maunula. Heli Rantanen, Architect heli.rantanen@tkk.fi Helsinki University of Technology Laboratory of Urban Planning and Design.

E N D
TED 19.-22.5.2005 MappingLocal Knowledge – Possibilities of WebGIS in Urban Planning Experiments in Maunula Heli Rantanen, Architectheli.rantanen@tkk.fi Helsinki University of TechnologyLaboratory of Urban Planning and Design
“The shortcoming in diffusion of planning tools limits the utility of science to policy and decision making that is so essential for developing environmentally, socially, and economically healthy communities.” GIS and an Urban Planning Process According to Nedovic-Budic (2000) geographicinformation science could contribute to a planning process in five areas: • geographic information database development for planning-related analysis; • integration of geospatial technologies with urban models; • building of planning support systems; • facilitating discourse and participation in the planning process; • evaluation of planning practice and technological impact
The planning apparatus itself hasn’t changed much: new tools and practices are not being utilized as they should in municipal institutions, there is lack of GIS skills, and data bases in general should be exploited better (Rossi 2005). Old legal procedure controls the process. Urban Planning and Participation (Finland) • Land Use and Building Act 2000: municipalities were obliged to organize a participative planning process • Questions arised: • Who are the legitimite participants in an area (who are “allowed” to take part in planning process?) • Who produces the most qualified information: professionals and experts or the residents and other local stakeholders? • Who has the overall knowledge of a neighbourhood? • The use of the Internet aroused great expectations: true two-flow interaction made possible?
Local Knowledge of a Neighbourhood? • Locally attached every-day-life data • “true” places of activities (where the children actually play or where the pathways go) • arguments, opinions, points of views • contributions to a planning process: proposals, plans, visions • information with time axis: history of a place, experiences, memories • Often tacit and implicit, “common knowledge” • The challenge is to make this knowledge explicit and equal to the “hard technical data”. • Paradox of the Expertise of Laymen (Staffans 2004): • there are professionals and experts among the residents too – but they are not seen as “ordinary residents” and their input is often criticized by the municipal planners, who reproach the activists of “taking over the process” and value “the voice of the silent ones”.
Case Study: My Maunula-map and the City Quarter of Maunula • My Maunula –map (2003): producedin cooperation with the residents’ association, the City Planning Department of Helsinki and University of Technology, Department of Architecture • The map tool was due to support the Development of Maunula Shopping Centre–case (the residents wanted to demonstrate that the old mall area should be developed and rebuilt). • The residents could mark places with symbols: pleasant, unpleasant, unsafe or (traffic-related) dangerous places • A comment could be attached on each symbol in a coordinates • The planners were interested in the answerers (age group, sex, where they lived). Is a person’s opinion unworthy, if he/she lives next to the Shopping Centre? Is a good argument ignored if it is presented by a “wrong” person? • By surveying the results on-line as an illustration or a list, both planners and the residents themselves can form a ”mental map” of Maunula.
Illustration view and a search form Unpleasant and unsafe places in Maunula (all age groups) Access to ”data base”: theme maps
Some feedback from the residents In 1½ year’s time: 150 responses (of 7500 inhabitants): • 323 symbols, out of which a comment in 59 %: pleasant 109, unpleasant 87, unsafe 67 (– most of them in a shopping centre area - ) and dangerous traffic 60 • Some feedback from the residents: • female, 60 – 69: Easy to use! It would be so nice if this [map] helps bringing out opinions and the positive changes and even supports enduring the good surroundings. • male, 70 +: Interesting, stimulates thinking. • male, 50 – 59: Interesting initiative…especially the results are of interest! • male, 30 – 39: Reading maps and orienteering require some skills, though… • male, 40 – 49: I hope that with these comments I can influence on the well-being and cosyness of the neighbourhood. • male, 20 – 29: A good idea of mapping people’s opinions. • female, 30 – 39: … you can perceive the place as a whole better. • female, 30 – 39: A very good way to map the charachter of the area.
Maunula: residents, locality and communication Communication, publication • Produces new actors • Creates image of the city quarter, • “Playing board” in areal development, • Dialogue • Local service portal • A tool for actors • Efficient local media, widely read • Creates areal identity • Advertising place for local firms and enterprises • Comes out four times a year Local web site: A digital forum Local Newspaper: News of Maunula Community Studio (Internet TV) Interaction with the “out side world” Locality • Meeting place • Networking • Organizing • Close to the inhabitants and local actors • The base of projects • Operational tool • ICT tools for free use • Experts, researchers and decision makers together with the residents • Creates new information in the area • Maintains and stimulates local discussion • Creates networks • Brings up new projects • Strategic tool Local forums:People meetingeach other and sharing knowledge Net CenterMaunulan Mediapaja:work shop for residents and projects Networking, organizing Hannu Kurki 13.9.99/8.11.99/HR 4.12.2002
Some early conclusions …in a context of Maunula´s versatile resident activity on other sections too: • residents are willing and capable of evaluating their living environment as a whole (not just ”my back yard”) • they expect to have influence on it and to have some feedback • WebGIS applications must be very simple and easy to use. Even using layers (as in many web-map services offered by the cities) can be too difficult. • The application may give ”something in exhange”. A possibility to review the results and answers of the others can be rewarding enough. • Still: the most important reward would be the fact, that this citizen produced data would be of some importance.
Residents, Internet, GIS and the City:the different ways of influencing (not just participating) ! Other influencemethods: • Lobbying: using all the medium, Internet, press, face-to-face gatherings etc.- Direct contacts to the politicians and decision makers- recognizing how the planning process “really” works Municipality: Planners, Experts City Administration Politicians Decision Making Unfit planning practices Lack of GIS skillsin general ? Attitude problems ICT barrier A local data bank as an influence method : • Local “agents” and citizen activists as actors- “Leagalizing” fuzzy, informal local data- Residents controlling the data- Storing the process- Time axis!! WebGISapplication City Quarter’s Web Site A Place: Neighbourhood, Home Associations Elderly Entrepreneurs Maunula Residents Professionals Children
The role of the Internet and WebGIS? • WebGIS applications open – at least in theory – the data bases to the public unanswered questions about price, access, data security etc. • WebGIS applications tailored for the citizens tend to remain unattached to the official GIS systems of the city • Internet enables a two-way flow of information concerning a place but municipal planning system can’t often utilize this feature the practices of urban planning (in Finland) don´t support interaction and “shared expertise” (Staffans 2004) • Easy-to-use interface offers possibilities for many kinds of informal data gathering applications but they often remain unattached to the real planning procedure • Building, testing and embedding various kinds of planning support tools and methods is essential
Some Prospects • A local WebGIS application may function not only as a data collector for the municipality but as a local data bank for the residents themselves: • It can help them to gain a more comprehensive understanding of the nature and potentials of their neighbourhood. • Embedded in other local activities and medium a local map application supports local knowledge creation • A map interface seems to offer an easy enough access to information (which can be hard to find in hierarchial data management systems) • Experiences as in Maunula during the last 5-6 years show, that the role of the Internet in general has become more and more important: • The Web gives third sector actors a possibility to have (some) control over the information and publicity a concerning them
OPUS-project Social process simulations and ICT-based methods as bridge builders USER EXPERIENCES PLANNING PRACTICES OSALLISET TACIT KNOWLEDGE THE KNOWLEDGE BASE OF URBAN PLANNING
OPUS contribution to the issue • A Development Forum of an area (Centre of Espoo) will be designed and built up in the Internet in cooperation with the local actors, entrepreneurs and the City of Espoo • The Forum will be maintained by local actors during and after the project • Different kinds of map-based interfaces will be developed based on earlier experiences in Maunula and other urban neighbourhoods (City Quarters). • Important feature to be developed further: time axis and history attributes in spatial data so that it would be possible to go back to different phases of the development process. • No one actually stores the whole planning process with all the including information • The focus will be in the city planning process itself; the aim is dissemination of new planning tools and participative methods.
References: • Bäcklund, P (toim.). (2003): Tietoyhteiskunnan osallistuva kansalainen. Tapaus Nettimaunula.Helsingin kaupungin tietokeskuksen tutkimuksia. 5/2003 • Nedovic-Budic, Z. (2000):Geographic Information Science Implications for urban and regional palnning.URISA Journal, (Version 03/15/00) http://www.urisa.org/Journal/protect/vol12no2/nedovic/abstract.htm • Rossi, L. (2005): Tietotekniikan soveltaminen Maankäyttö- ja rakennuslain kaavojen toteutuksen ohjelmointiin.Tampereen teknillinen yliopisto. Julkaisu 525 • Staffans, A.: Vaikuttavat asukkaat. Vuorovaikutus ja paikallinen tieto kaupunkisuunnittelun haasteina.Yhdyskuntasuunnittelun tutkimus- ja koulutuskeskuksen julkaisuja A 29. Yliopistopaino Oy. • My Maunula –map: www.kaupunginosat.net/maunula/kartta • Maunula Web Site (new): www.maunula.net