Download
1 / 25
260 likes | 1.02k Views
Food Security Among Children. July 8, 2009 Office of Research and Analysis Food and Nutrition Service, USDA. Background. The President made a commitment to end childhood hunger by 2015.

E N D
Food Security Among Children July 8, 2009 Office of Research and Analysis Food and Nutrition Service, USDA
Background • The President made a commitment to end childhood hunger by 2015. • FNS is developing a plan that reflects actions to end childhood hunger by making existing programs as effective and accessible as possible in cooperation with partners and stakeholders; pursuing new strategies, policy changes, and program improvements in CN reauthorization, the annual budget request, and the next Farm Bill; and embracing other innovations identified through stakeholder and FNS input. • Today we will share what we know about food insecurity among children and participation in nutrition assistance programs to develop a shared working understanding of the problem as we move forward.
Data Source • USDA has monitored the extent of food insecurity in the United States since 1995. • Based on the December Food Security Supplement to the Current Population Survey and an annual survey of about 50,000 households conducted by the Census Bureau. • Households are classified based on their responses to 18 items known to characterize difficulty meeting basic food needs. • Some indicators of food security among children based on two years of data (2006-2007) to provide more stable and reliable estimates.
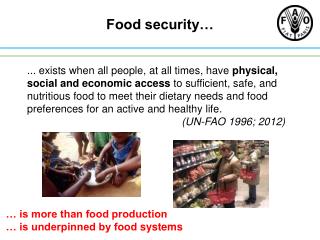
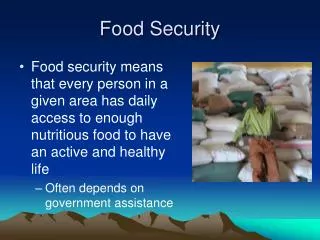
Definitions • Food Secure: All household members have access at all times to enough food for an active, healthy life. • Food Insecure: Household is uncertain of having, or unable to acquire, enough food to meet basic needs for all household members at some time during the year because they can not afford enough food. • Very Low Food Security: Households in which the food intake of some household members is reduced and normal eating patterns disrupted at some time during the year because the household cannot afford enough food.
Food Insecurity Versus Hunger • Food Insecurity: Household-level economic and social condition of limited access to food. • Hunger: Person-level physiological condition that may result from food insecurity. • Information on prevalence of hunger hampered by lack of consistent definition and validated method of measurement.
Most American Households Food Secure in 2007 • 104.1 million households (88.9%) were food secure throughout the year. • 13.0 million households (11.1%) were food insecure at some time during the year. • 4.7 million households (4.1%) experienced very low food security at some time during the year. Low Food Security 7.0% Food Insecure 11.1% Food Secure 88.9% Very Low Food Security 4.1%
Households with Children Experienced Slightly Higher Rates of Food Insecurity in 2007 • 33.2 million households with children (84.2%) were food secure throughout the year. • 3.0 million households (7.5%) experienced low food security among children at some time during the year. • 323,000 households (0.8%) experienced very low food security among children at some time during the year. Low Food Security Among Children 7.5% Very Low Food Security Among Children 0.8% Food Insecure (adults only) 7.5% Food Secure 84.2%
Children Often Protected From Hunger • Households with children were nearly twice as likely as those without children to report food insecurity (15.8 vs. 8.7 percent). • But in nearly 50 percent of food insecure households with children, children were protected from substantial reductions in food intake. • Young children, in particular, may have experienced only mild effects or none at all.
Food Insecurity Changed Little from 1999 to 2007 • Prevalence of food insecurity among children up slightly from 8.2 percent to 8.3 percent. • Prevalence of very low food security among children up from 0.6 percent to 0.8 percent. Percent of Households with Children Food insecure (adults and children) Food insecure (children) Very low food security (children)
Food Insecurity Among Children Varies by State Below U.S. Average Near U.S. Average Above U.S. Average
Characteristics of Food Insecure Children Similar to Overall Food Insecure Population • While prevalence is lower among children, trends are similar over time. • Similar household characteristics have prevalence higher than national average: • Income near or below poverty line • Black and Hispanic households • Geographically, in large cities and rural areas
Variety of Conditions Found in Households with Food Insecurity Among Children Percent of Households with Food Insecurity Among Children • Households with low food security mainly reported reductions in quality/variety of children’s meals. • Households with very lowfood security all reported multiple indications of reduced food intake.
Half of Households with Food Insecurity Among Children are Headed by Single Females Heads of Households with Food Insecurity Among Children • Among households with very low food security among children, 54 percent are headed by a single-female. • In contrast, 38 percent are two-parent households. Other 2% Single Male 7% Single Female 50% Two Parents 41%
Minorities are Over-Represented Among Households with Food Insecurity Among Children Race/Ethnicity of Households with Food Insecurity Among Children • In households with very low food security among children, representation of minorities higher: • 28 percent from Black non-Hispanic households • 33 percent from Hispanic households • 33 percent from White non-Hispanic households. Other 4% Hispanic 30% White non-Hispanic 42% Black non-Hispanic 24%
Most Households Have Earnings but Many Remain in Poverty • 78 percent of households with food insecurity among children contained one or more adults employed full time or part time. • 41 percent of households below poverty line. • 21 percent above 185 percent of poverty.
Food Insecurity Varies By Age of Oldest Child and Family Composition Prevalence of Food Insecurity Among Children by Age of Oldest Child in Household • Suggests older children experience food insecurity at higher rates. • Households with three or more children experience food insecurity at higher rates than households with fewer children. Age of Oldest Child Prevalence of Food Insecurity Among Children by Number of Children in Household
FNS Programs Are Serving Food Insecure Children Percent of Households with Food Insecurity Among Children • In 2006-2007, most households with food insecurity among children participated in SNAP, school lunch, or WIC.
Major Nutrition Assistance Programs for Children • SNAP: Foundation of USDA nutrition safety net. Targeted monthly benefit to households for purchase of wide variety of food items at authorized retailers. • Food Distribution Program on Indian Reservations: Alternative to SNAP. Monthly food package to households living on or near Indian Reservations. • School Breakfast Program: Nutritionally balanced breakfasts for students each school day. • School Lunch Program: Nutritionally balanced lunches and snacks for students each school day. • WIC: Monthly benefit to qualifying women, infants and children for purchase of specific foods to supplement their diets.
Summer Food Service Program: Daily meals and snacks to children in low-income areas during the summer and other school vacations. • Child and Adult Care Food Program: Daily meals and snacks to children in day care, emergency shelters and after school programs. • The Emergency Food Assistance Program: Food commodities delivered to food banks and then through shelters and food pantries to families as available.
0 2 4 6 8 10 12 14 16 18 Special Supplemental Nutrition Assistance Program for Women, Children, and Infants (WIC) 6.5 million infants and children National School Lunch Program (NSLP) 31 million children • School Breakfast Program • 10.5 million children Special Milk Program 90 million half-pints milk (FY07) Summer Food Service Program (SFSP) 2.1 million children Child and Adult Care Food Program (CACFP) 2.9 million children • The Emergency Assistance Food Program (TEFAP) Supplemental Nutrition Assistance Program (SNAP) 12.7 million children (FY07) Food DistributionProgram on Indian Reservations (FDPIR) ~ 30,000 children FNS Programs Serve Children from Birth to Age 18 Age of Children Served (FY08 Participation Levels)
Many Children Participate in Multiple FNS Programs • In 2002, percent of children receiving SNAP benefits that participate in… • School lunch (free/reduced) – 83 percent • School breakfast (free/reduced) – 65 percent • WIC – 64 percent • In 2002, percent of children receiving free or reduced price lunch (NSLP) that participate in… • SNAP – 30 percent • School breakfast (free/reduced) – 63 percent
Commonly Reported Barriers to FNS Program Participation • SNAP: Most common reasons include lack of information about eligibility, view that benefits not needed, dissatisfaction with benefit amount, complex application process, and stigma. • School Breakfast Program: Already eat at home and meal not served in classroom. • School Breakfast and Lunch Programs: Prefer food from home, lack information about eligibility for free/reduced price meals, application concern among immigrants, and stigma. • WIC: Transportation to clinic, limited clinic hours, long clinic wait times. • SFSP: Limited availability of sites, transportation to sites, limited duration of site programs. • CACFP: Limited availability of child care providers in Program and too much paperwork for providers.